Select to view content in your preferred language

Spider Diagram Geoprocessing Tool

16130
9
09-07-2018 04:01 PM
BobGerlt
Esri Contributor
16 9 16.1K

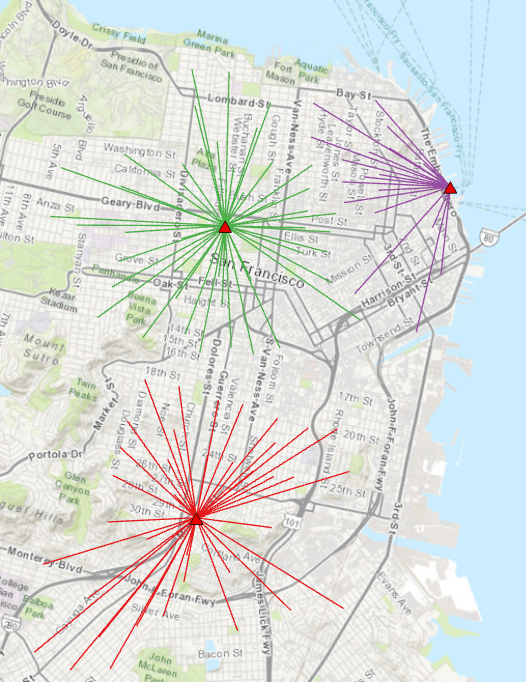
The map above shows some spider diagrams. These diagrams are useful for presenting spatial distribution, for example, customers for a retail outlet or the hometowns of university students. The lab was recently tasked with creating an automated spider diagram tool without using Business Analyst or Network Analyst. The result of our work is in the Spider Diagram Toolbox for use by either ArcGIS Pro or ArcGIS Desktop.

Installation is fairly straight forward. After downloading the zip file, decompress and place the following files on your desktop.:

  • SpiderDiagram.pyt,
  • SpiderDiagram.pyt.xml,
  • SpiderDiagram.Spider.pyt.xml, and
  • SpiderDiagramReadme.pdf

In ArcGIS PRO or ArcMap you may connect a folder to this the desktop folder so that you access these files.

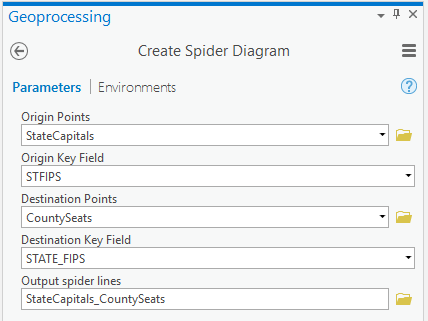
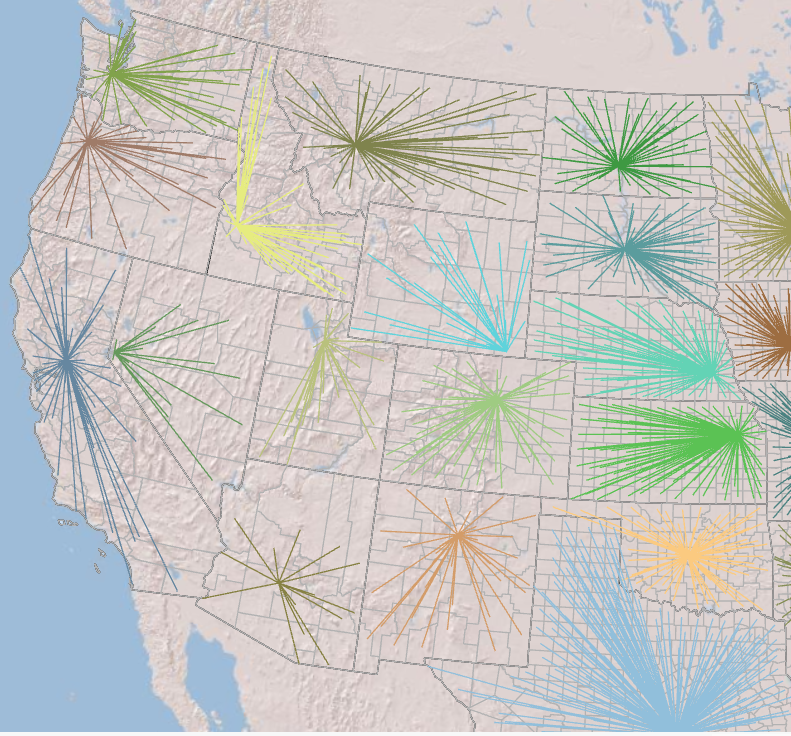
Running the tool is also easy. The tool dialog will prompt you for the origin and destination feature classes as well as the optional key fields that will link destination points to origin points. In the example below, the county seats are related to state capitals by the FIPS code.
Result:
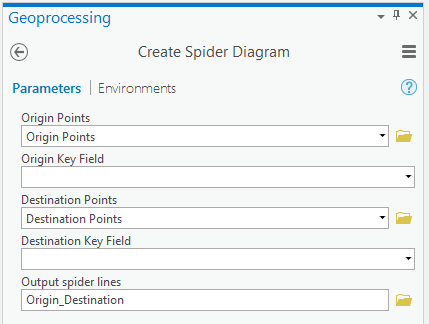
Leave one or both key fields blank to connect each origin point to every destination point.
Result:
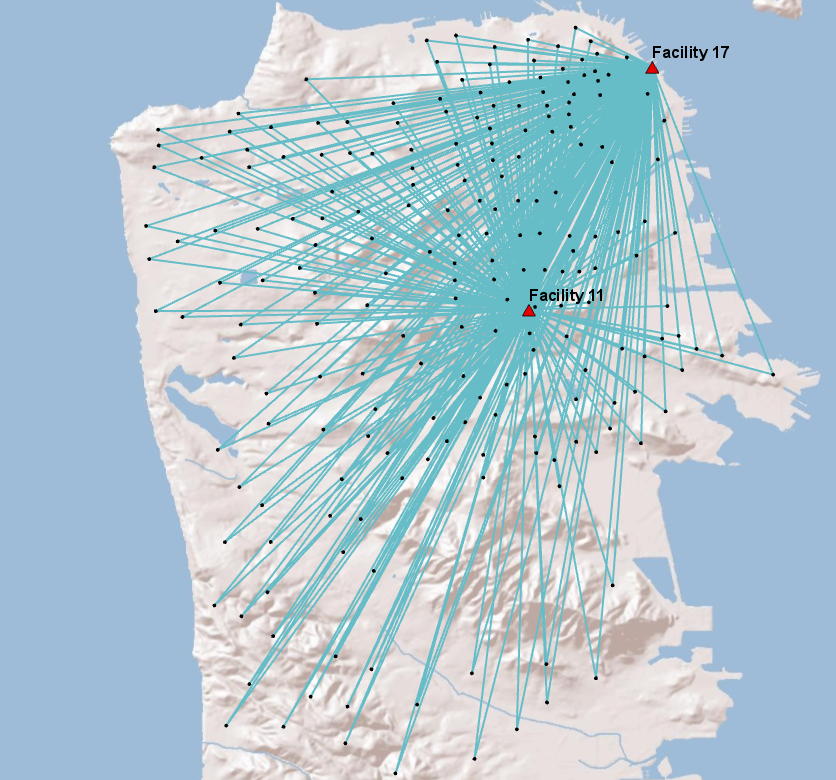
Which is the origin and which is the destination feature class?  It really doesn’t matter for this tool – either way will work.  If you want to symbolize the result with an arrow line symbol, know that the start point of each line is the location of points in the origin feature class.

Script and article written by Mark Smith‌.

Please direct comments to bgerlt-esristaff‌.

9 Comments
SeanMcGee1
Regular Contributor

Great stuff! Will give this a shot.

We had a similar challenge working with live data/web. Wrote a module for the ArcGIS JavaScript API - https://apps.esriuk.com/app/spidermaps/1/wmt/view/fd95dfb7e2b843ee90d23b67606e6b4c/index.html 

by Anonymous User
Not applicable

I want to connect this with GeoEvent Server and our AMI meters, then symbolize lines based on strength of signal from meter to repeaters and base stations. Then using the temporal data replay the data overtime to identify areas that need additional equipment. This could help improve the design of an AMI system.

JohnDye2
Frequent Contributor

This is pretty great. Awesome work Richie. I see one small improvement that can be made here. The tool already goes 'all-to-all' if the key fields are not specified. An additional parameter could be added to specify a cutoff distance so that when the tool is executing all-to-all, only those Origin-Destionation pairs which fall within the defined distance threshold are returned. Of course, in order to do this the tool does still need to iterate over all OD pairs so the runtime is the same - actually a little longer, but the result is a little more simplified and doesn't require any post-processing by the user.

I think I'll be adding this to my toolkit. Excellent stuff.

SharonJanzen
Deactivated User

This looks promising but is there a way to add a weight to the line based on a certain field?

JoshuaBixby
MVP Esteemed Contributor

I agree, field-based symbol weighting is crucial.

BobGerlt
Esri Contributor

Using the OriginFID and/or the DestinationFID fields you can do a GP Add Join or Join Field to add fields from the Origin or Destination feature classes.  Once you have the fields added you can then symbolize those fields.  

deleted-user-qpvAI3Fo0MKR
Deactivated User

Please let me know if you've had success with this - I know our AMI team would be thrilled to see this functionality.

RogérioAzevedo
New Explorer

"In ArcGIS PRO or ArcMap you may connect a folder to this the desktop folder so that you access these files."
HOW, man, HOW can I do it????? Help...

CarolSousa
Esri Contributor

@RogérioAzevedo after downloading the zip file, if you extract to (for example) C:\Demos\SpiderDiagram, you would then open ArcGIS Pro, go to Insert tab on the ribbon, click Add Folder, then navigate in the Add Folder Connection window to C:\Demos and select SpiderDiagram, then click OK.

CarolSousa_0-1656519714087.png

Then you can get to the folder from the Catalog pane.

About the Author
Member of the Esri Applications Prototype Lab Spatializing in Python, 3D, CCM, Centrality, Flow Maps and Raster in general