- Home
- :
- All Communities
- :
- Products
- :
- 3D
- :
- 3D Questions
- :
- Re: vertical exaggeration
- Subscribe to RSS Feed
- Mark Topic as New
- Mark Topic as Read
- Float this Topic for Current User
- Bookmark
- Subscribe
- Mute
- Printer Friendly Page
vertical exaggeration
- Mark as New
- Bookmark
- Subscribe
- Mute
- Subscribe to RSS Feed
- Permalink
Hi,
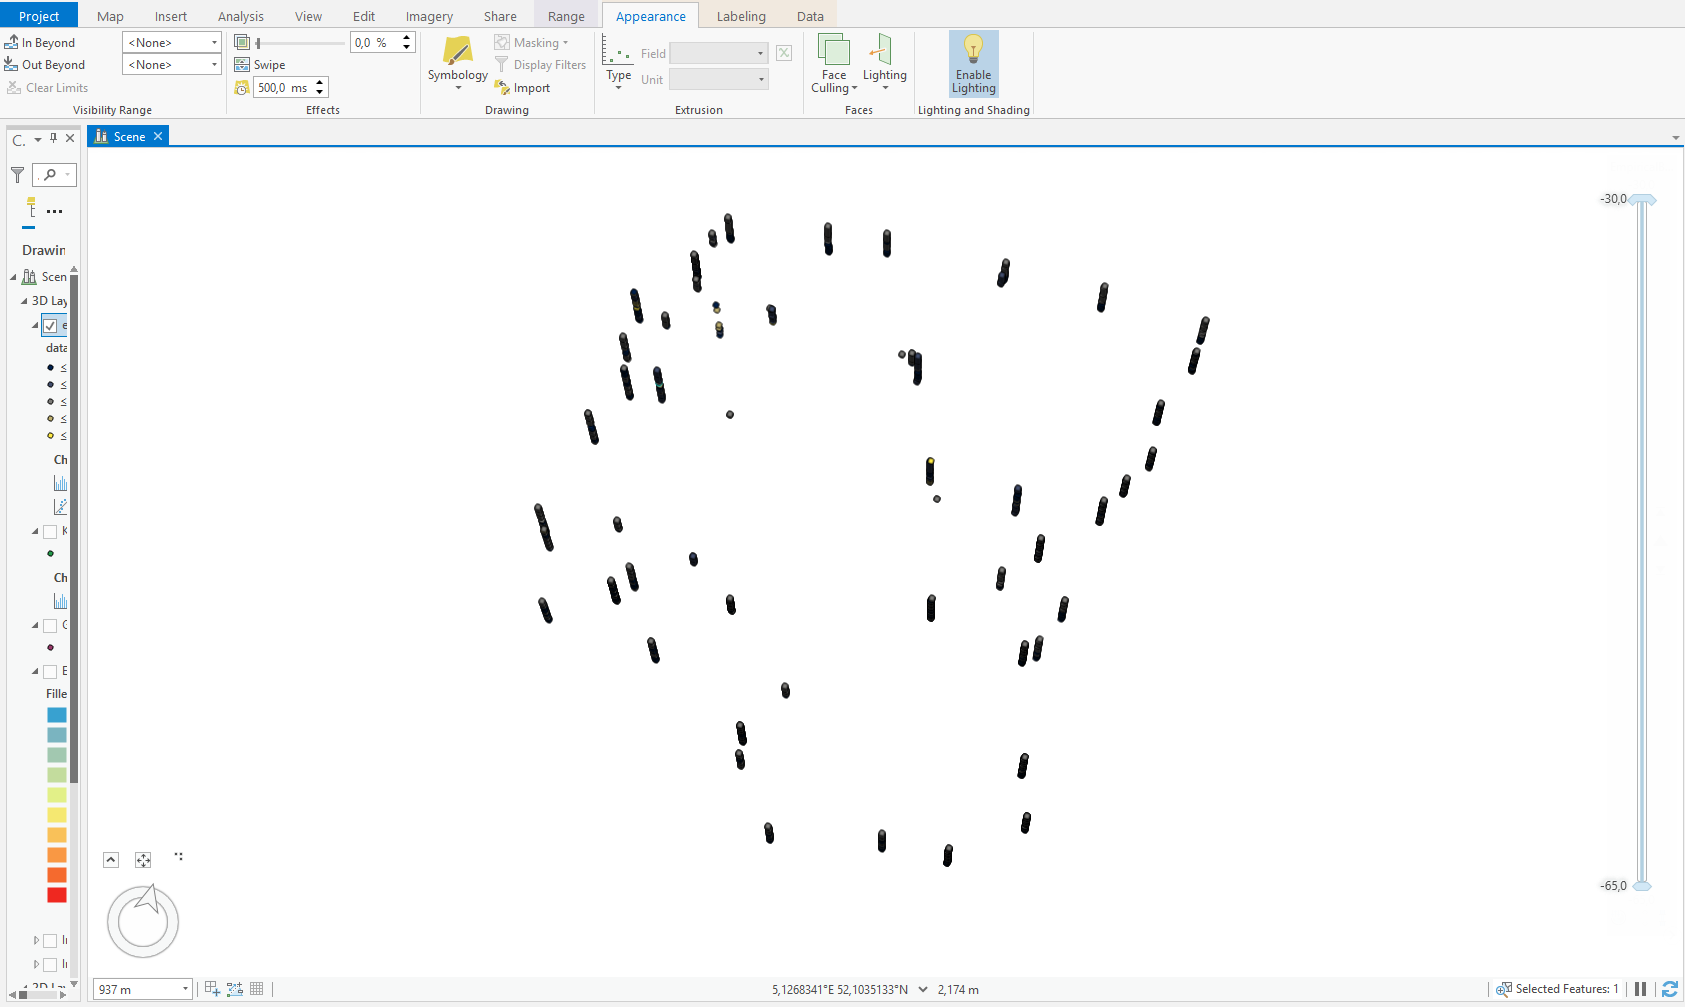
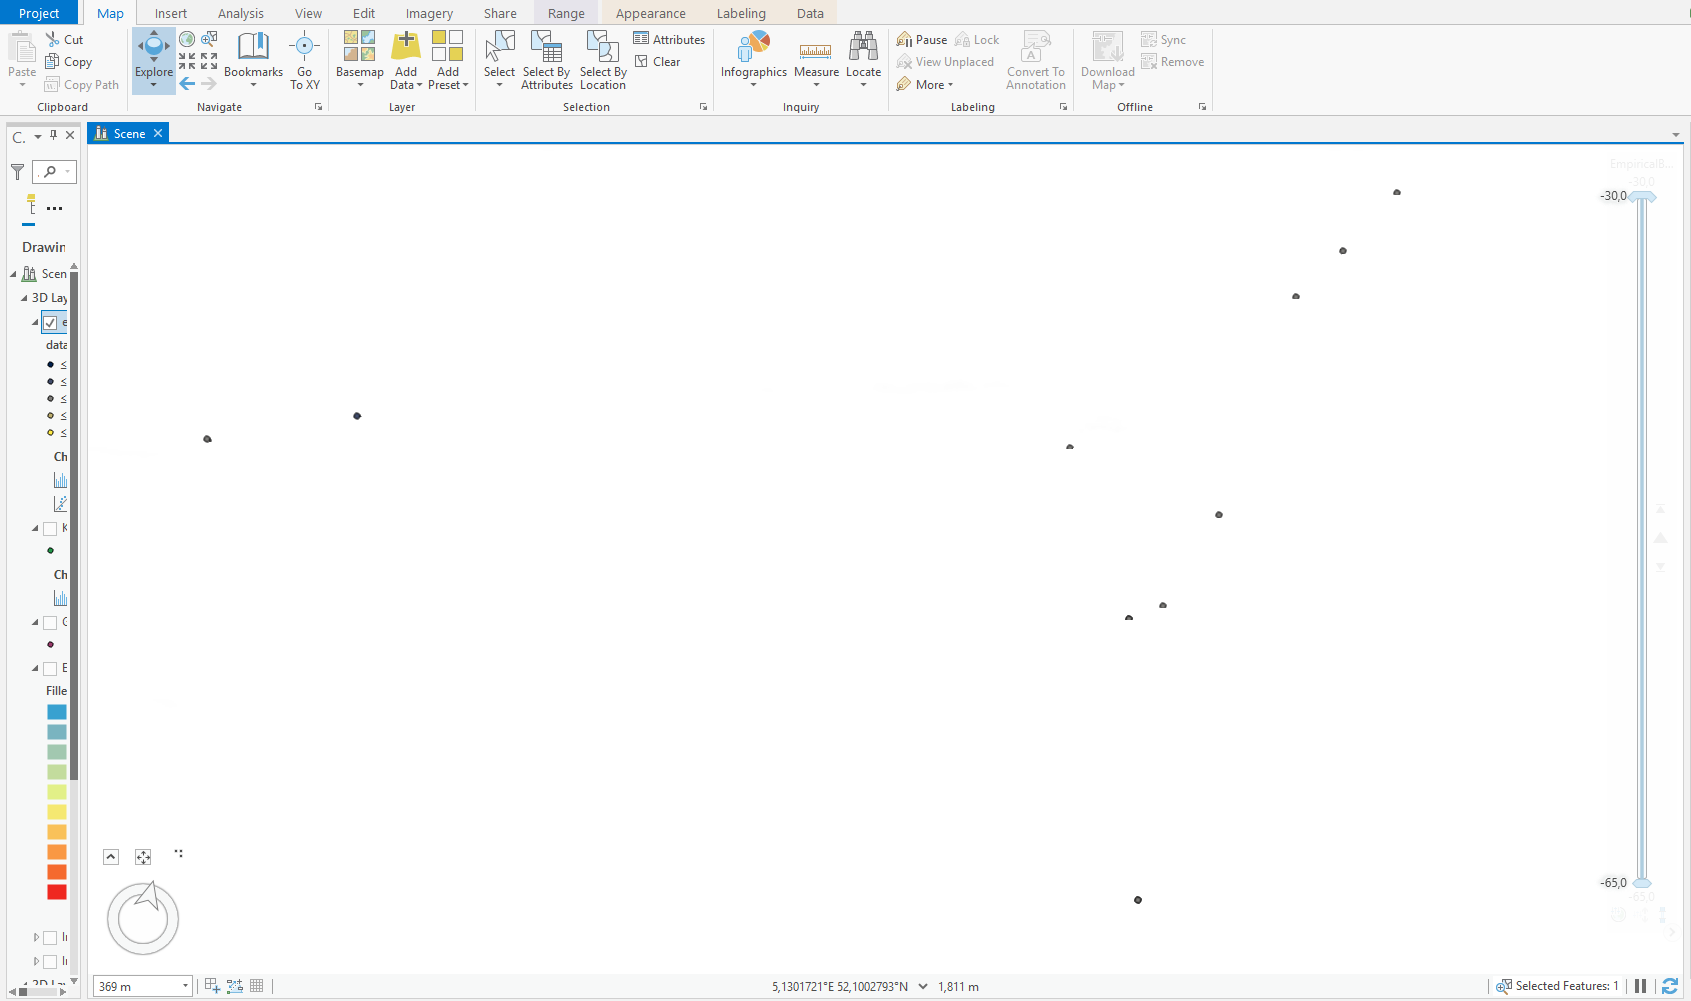
I have a set of 3d point data (hydraulic conductivity according to performed drillings). I want to use this dataset for geostatistical interpolation. To be able to start with an investigation of my dataset I coloured the values with a gradient. I see my data as below. The datapoints are too close together in the vertical direction to be able to study them. When I zoom in by scrolling the mouse, the dots disappear from view (see bottom picture). With the sliding bar on the right I can't seem to do anything for the view.
I thought I use a vertical exaggeration, but I don't see how (there is no option for it under the appearance tab).
Does anyone have an idea how to solve this?
Thanks, Suzanne
- Mark as New
- Bookmark
- Subscribe
- Mute
- Subscribe to RSS Feed
- Permalink
Dear Andrew and Eric,
Thanks so much, you were right! The coordinates of the voxel, EBK and data layers matched, but they didn't match with the local scene coordinate system itself (I didn't know that it also has one..). Here some pictures of my results  :
:

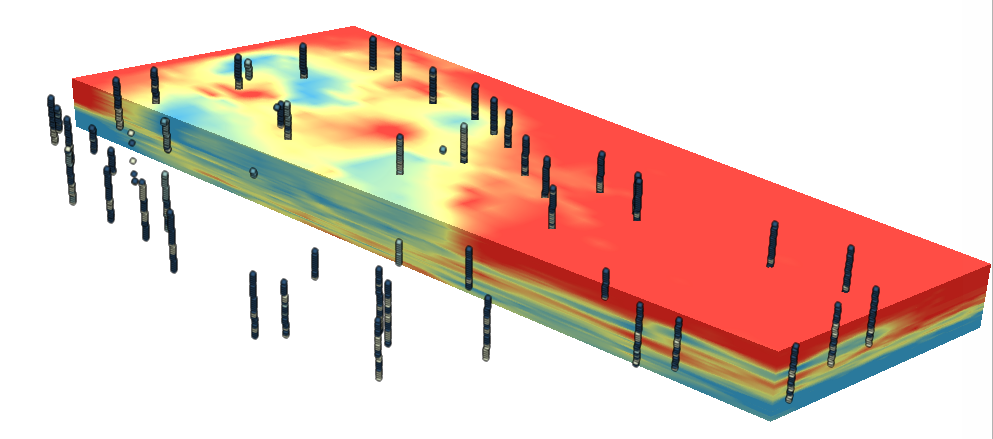
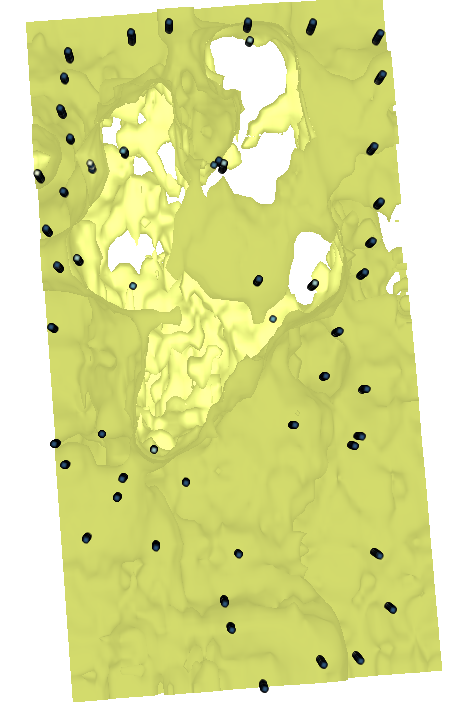
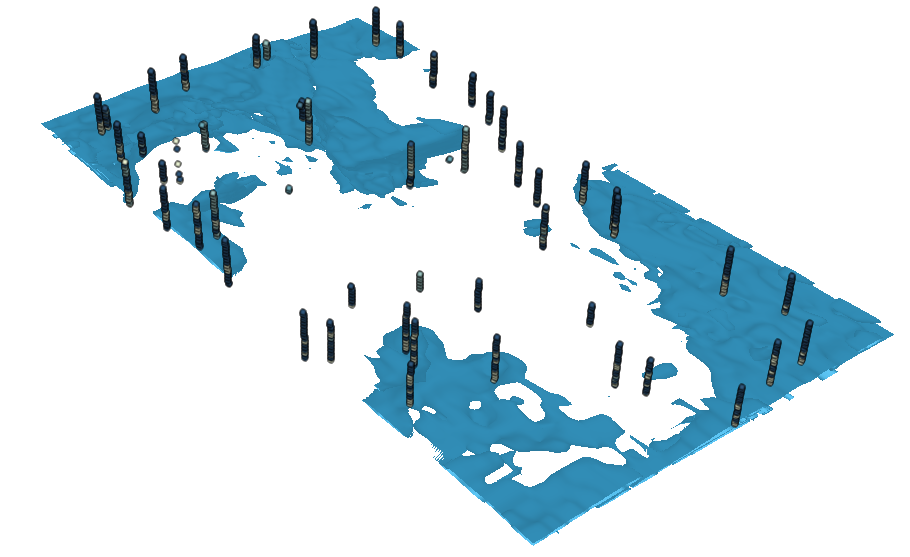
Eric Krause and Philip Mielke thanks for your help with making this work - and even better than I thought!
My next challenge will be to export the EBK3D data in a way such that I can use it as input for hydraulic conductivity fields for a Modflow model. I'm guessing the best way to go forward is to use the Layer 3D To Feature Class. I will have a look at that, but might be back to pick your brains on it again later 
Regards,
Suzanne
- Mark as New
- Bookmark
- Subscribe
- Mute
- Subscribe to RSS Feed
- Permalink
Glad to hear you got the voxel to render! For your next step, look into the GA Layer To Points tool. It can be used to export the values of the EBK3D layer directly to 3D point features.
- Mark as New
- Bookmark
- Subscribe
- Mute
- Subscribe to RSS Feed
- Permalink
Hey,
I actually have a question about the voxel space data. How come the range is different for the EBK3D predictions and the voxels? Especially the negative values surprise me..
Suzanne

- Mark as New
- Bookmark
- Subscribe
- Mute
- Subscribe to RSS Feed
- Permalink
Hi Suzanne,
In order to render the voxel layer as quickly as possibly we scan only about 2 million voxels to generate the min/max range for the stretch renderer so this employs a standard deviation measure which means the outliers would not necessarily show up in the initial stretch range even though the values are still there in the voxel layer. You can manually adjust the min/max stretch range in the symbology pane. In the ArcGIS Pro 2.7 release we have developed a way to get the full min/max range without taking a performance hit so you'll see the full range. I hope that clarifies it let me know if you have any other questions.
thanks,
Andrew
- Mark as New
- Bookmark
- Subscribe
- Mute
- Subscribe to RSS Feed
- Permalink
Hi Suzanne,
In addition to the differences in the min/max renderer of the voxel versus the classified renderer of the geostatistical layer, there are also even more fundamental differences.
The geostatistical layer actually builds its histogram (used to create the class breaks) on the values of the original points you interpolated. The voxel layer instead classifies using the values of the netCDF file. In general, the voxel layer will be a much better representation of what the 3D volume actually looks like. There is an exactly analogous concept with exporting 2D geostatistical layers to 2D rasters, where the exported raster often looks very different and has different ranges than the geostatistical layer.
This is also why the minimum value of the voxel symbology is less than the minimum value of the geostatistical layer symbology. Some areas of the voxel had predicted values less than the minimum of the original points you interpolated. This can happen for lots of different reasons, but it's likely related to transformations and trends in the EBK3D model.
As for why the geostatistical layer operates like this, it's best to think of the geostatistical layer as a function that does rendering on the fly. It takes an (x,y) or (x,y,z) coordinate as input and computes the value using references to the interpolation parameters and input points. Unlike a raster of a voxel layer, it does not have output data written anywhere to disk. In a sense, the geostatistical layer doesn't know its own values until you do something that requires the calculation. The filled contours you actually see in the map are just generated by contouring a coarse triangular grid behind the scenes. The benefits of this are that the geostatistical layer calculates and renders very quickly, and it can be used as a model source to easily export to numerous other data formats: rasters, points, contours, voxels, multidimensional rasters, etc.
Hope that made sense,
-Eric
- Mark as New
- Bookmark
- Subscribe
- Mute
- Subscribe to RSS Feed
- Permalink
Dear Andrew and Eric,
thank you for your responses.
I have to admit I am a little confused about the fundamentals of this issue. But let me ask a few straightforward questions to see if I can at least understand the implications:
1. The values I see in the voxel layer do come from the EBK3D analysis. That the EBK3D didn't show them to me before is because it has made its (and our) life a bit easier (runs quick) by visualising a triangular grid and 'spreading' the range of values of the original data set over it?
2. That means that whatever export format I choose for the statistical layer (for example 'to points') I will obtain the values that I now see in my voxel layer?
3. Some of the values I obtain are nonphysical (i.e. the negative values), does this not mean something is fundamentally wrong about the statistical analysis? Especially if the values are really quite different from the original data set (for example if my data ranges from 0.1 to 80 and the voxel layer shows results between -20 and 60)?
4. Wouldn't adjusting the min/max range in the above mentioned case from -20 and 60 to 0.1 and 80 be cheating? It seems I would then be ignoring what the geostatistical analyst has told me..
Thanks again in advance!
Suzanne
- Mark as New
- Bookmark
- Subscribe
- Mute
- Subscribe to RSS Feed
- Permalink
Hi Suzanne,
You're pretty much correct in your first three questions. I'll add a few notes:
1. The values I see in the voxel layer do come from the EBK3D analysis. That the EBK3D didn't show them to me before is because it has made its (and our) life a bit easier (runs quick) by visualising a triangular grid and 'spreading' the range of values of the original data set over it?
Yes. To build a representative histogram of the output surface, the geostatistical layer would have to make many calculations. By borrowing the histogram of the input points, it can process much more quickly. However, it is just a rough visualization of what the surface actually looks like.
2. That means that whatever export format I choose for the statistical layer (for example 'to points') I will obtain the values that I now see in my voxel layer?
Yes, all the geostatistical layer does is call a function that returns a prediction (and possibly standard errors) at a coordinate and then writes the value(s) to an output format. As far as the geostatistical layer is aware, exporting to points, voxels, rasters, etc are all just sets of coordinates used to call this function.
After exporting to whatever format, the renderer of the output is always built on the predicted values stored in that format. So, for example, exporting to a raster will build the render using the entire histogram of the raster. Similarly with a voxel, the renderer is built on the range of the entire 3D volume (with extremes excluded, as Andrew noted).
3. Some of the values I obtain are nonphysical (i.e. the negative values), does this not mean something is fundamentally wrong about the statistical analysis? Especially if the values are really quite different from the original data set (for example if my data ranges from 0.1 to 80 and the voxel layer shows results between -20 and 60)?
Most likely, this behavior indicates that the EBK3D model doesn't fit the data well. Kriging of all types has a tendency to smooth the input data, where the range of the predictions is narrower than the range of the input data. However, it can also make predictions outside of the range of the input points. You're actually seeing both at the same time, where both the min and max of the predictions were lower than the min/max of the original data points; it smoothed off the top but extend the bottom of the distribution. I suspect this is due to the shape of the histogram of the original points, which was heavily right-skewed and had constant values.
You should try to identify where the largest deviations are in the 3D volume. It's possible that you'll find them far off in a corner away from the points, but the still model fits well in the areas where you have data. If that doesn't work out, I don't have very many recommendations aside from what I already suggested: trying different subset sizes, overlap factors, and transformations.
4. Wouldn't adjusting the min/max range in the above mentioned case from -20 and 60 to 0.1 and 80 be cheating? It seems I would then be ignoring what the geostatistical analyst has told me..
I wouldn't call it cheating as long as you disclose what you're doing. It's well understood that kriging doesn't understand what the data means (so it won't respect physical impossibilities), and the predictions become unstable when extrapolating. Simply removing these areas or setting them transparent is very common, but should of course be disclosed. You're not actually changing any data when you do this, just choosing to not display results that you know to be misleading or impossible. Ideally, you'll just find a perfect EBK3D model that doesn't require this, but assuming this doesn't happen, in my opinion, it's better to not display results you know to be wrong.
-Eric
- Mark as New
- Bookmark
- Subscribe
- Mute
- Subscribe to RSS Feed
- Permalink
That is clear, wonderful, thanks!!
Suzanne
- « Previous
- Next »
- « Previous
- Next »