- Home
- :
- All Communities
- :
- Products
- :
- 3D
- :
- 3D Mapping Questions
- :
- Re: Profile Graph x axis error in Pro
- Subscribe to RSS Feed
- Mark Topic as New
- Mark Topic as Read
- Float this Topic for Current User
- Bookmark
- Subscribe
- Mute
- Printer Friendly Page
Profile Graph x axis error in Pro
- Mark as New
- Bookmark
- Subscribe
- Mute
- Subscribe to RSS Feed
- Permalink
I have a simple line feature class with z values. There are 20 lines that are each 56 meters in length. The z values were generated using the Interpolate Shape tool within 3d analyst toolbox.
Using ArcGIS Pro 2.1.1, I am creating Profile Graphs of each of the 20 lines. In these graphs, the x axis for every line extends to over 80 meters. At first I thought the horizontal distance might be inclusive of the terrain, but regardless of the terrain (z value) complexity, the horizontal distance does not vary.
If I create a profile graph in ArcGIS Desktop 10.6 with the exact same data set, the x axis distance for all profile graphs is consistently set to what I would expect - 56 meters - which ignores variability of the terrain, but at least doesn't consistently add 20+ meters.
Can anyone help? What am I missing?
Thanks
- Mark as New
- Bookmark
- Subscribe
- Mute
- Subscribe to RSS Feed
- Permalink
And you have gone through the 'Properties' option for the axes to see if you can set more than the unit? I don't have one to test, but I would assume that you should be able to set the distance start/stop for the x axis as well
http://pro.arcgis.com/en/pro-app/help/analysis/geoprocessing/charts/profile-graph.htm
- Mark as New
- Bookmark
- Subscribe
- Mute
- Subscribe to RSS Feed
- Permalink
Thank you - on the chart properties I only see the ability to change the display units of the axes.
Data are in meters, coordinate system WGS_1984 UTM Zone 17N.
The 3d lines were interpolated from a Digital Elevation Model also in WGS_1984 UTM Zone 17N
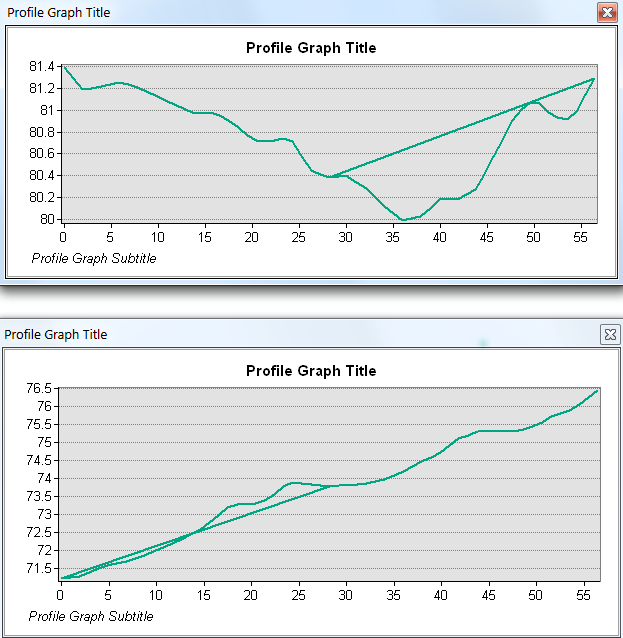
Update - problem solved.....exported the data out of the gdb to a shapefile. Using ArcMap 3D analyst profile graphs
I found that for each line, there was an extra segment that had somehow snapped back on itself. Pretty sure the Profile Graph in Pro showed me this overlapping arc as a continuation of the line - not sure why.... Thank you for responding to my original post.
- Mark as New
- Bookmark
- Subscribe
- Mute
- Subscribe to RSS Feed
- Permalink
strange... looks like it snaps back on the midpoint. and if you look at the graphs closely, there is a straight line segment within the profile.