- Home
- :
- All Communities
- :
- Products
- :
- 3D
- :
- 3D Mapping Questions
- :
- Re: How would I insert Grid and Graticules in ArcS...
- Subscribe to RSS Feed
- Mark Topic as New
- Mark Topic as Read
- Float this Topic for Current User
- Bookmark
- Subscribe
- Mute
- Printer Friendly Page
How would I insert Grid and Graticules in ArcScene?
- Mark as New
- Bookmark
- Subscribe
- Mute
- Subscribe to RSS Feed
- Permalink
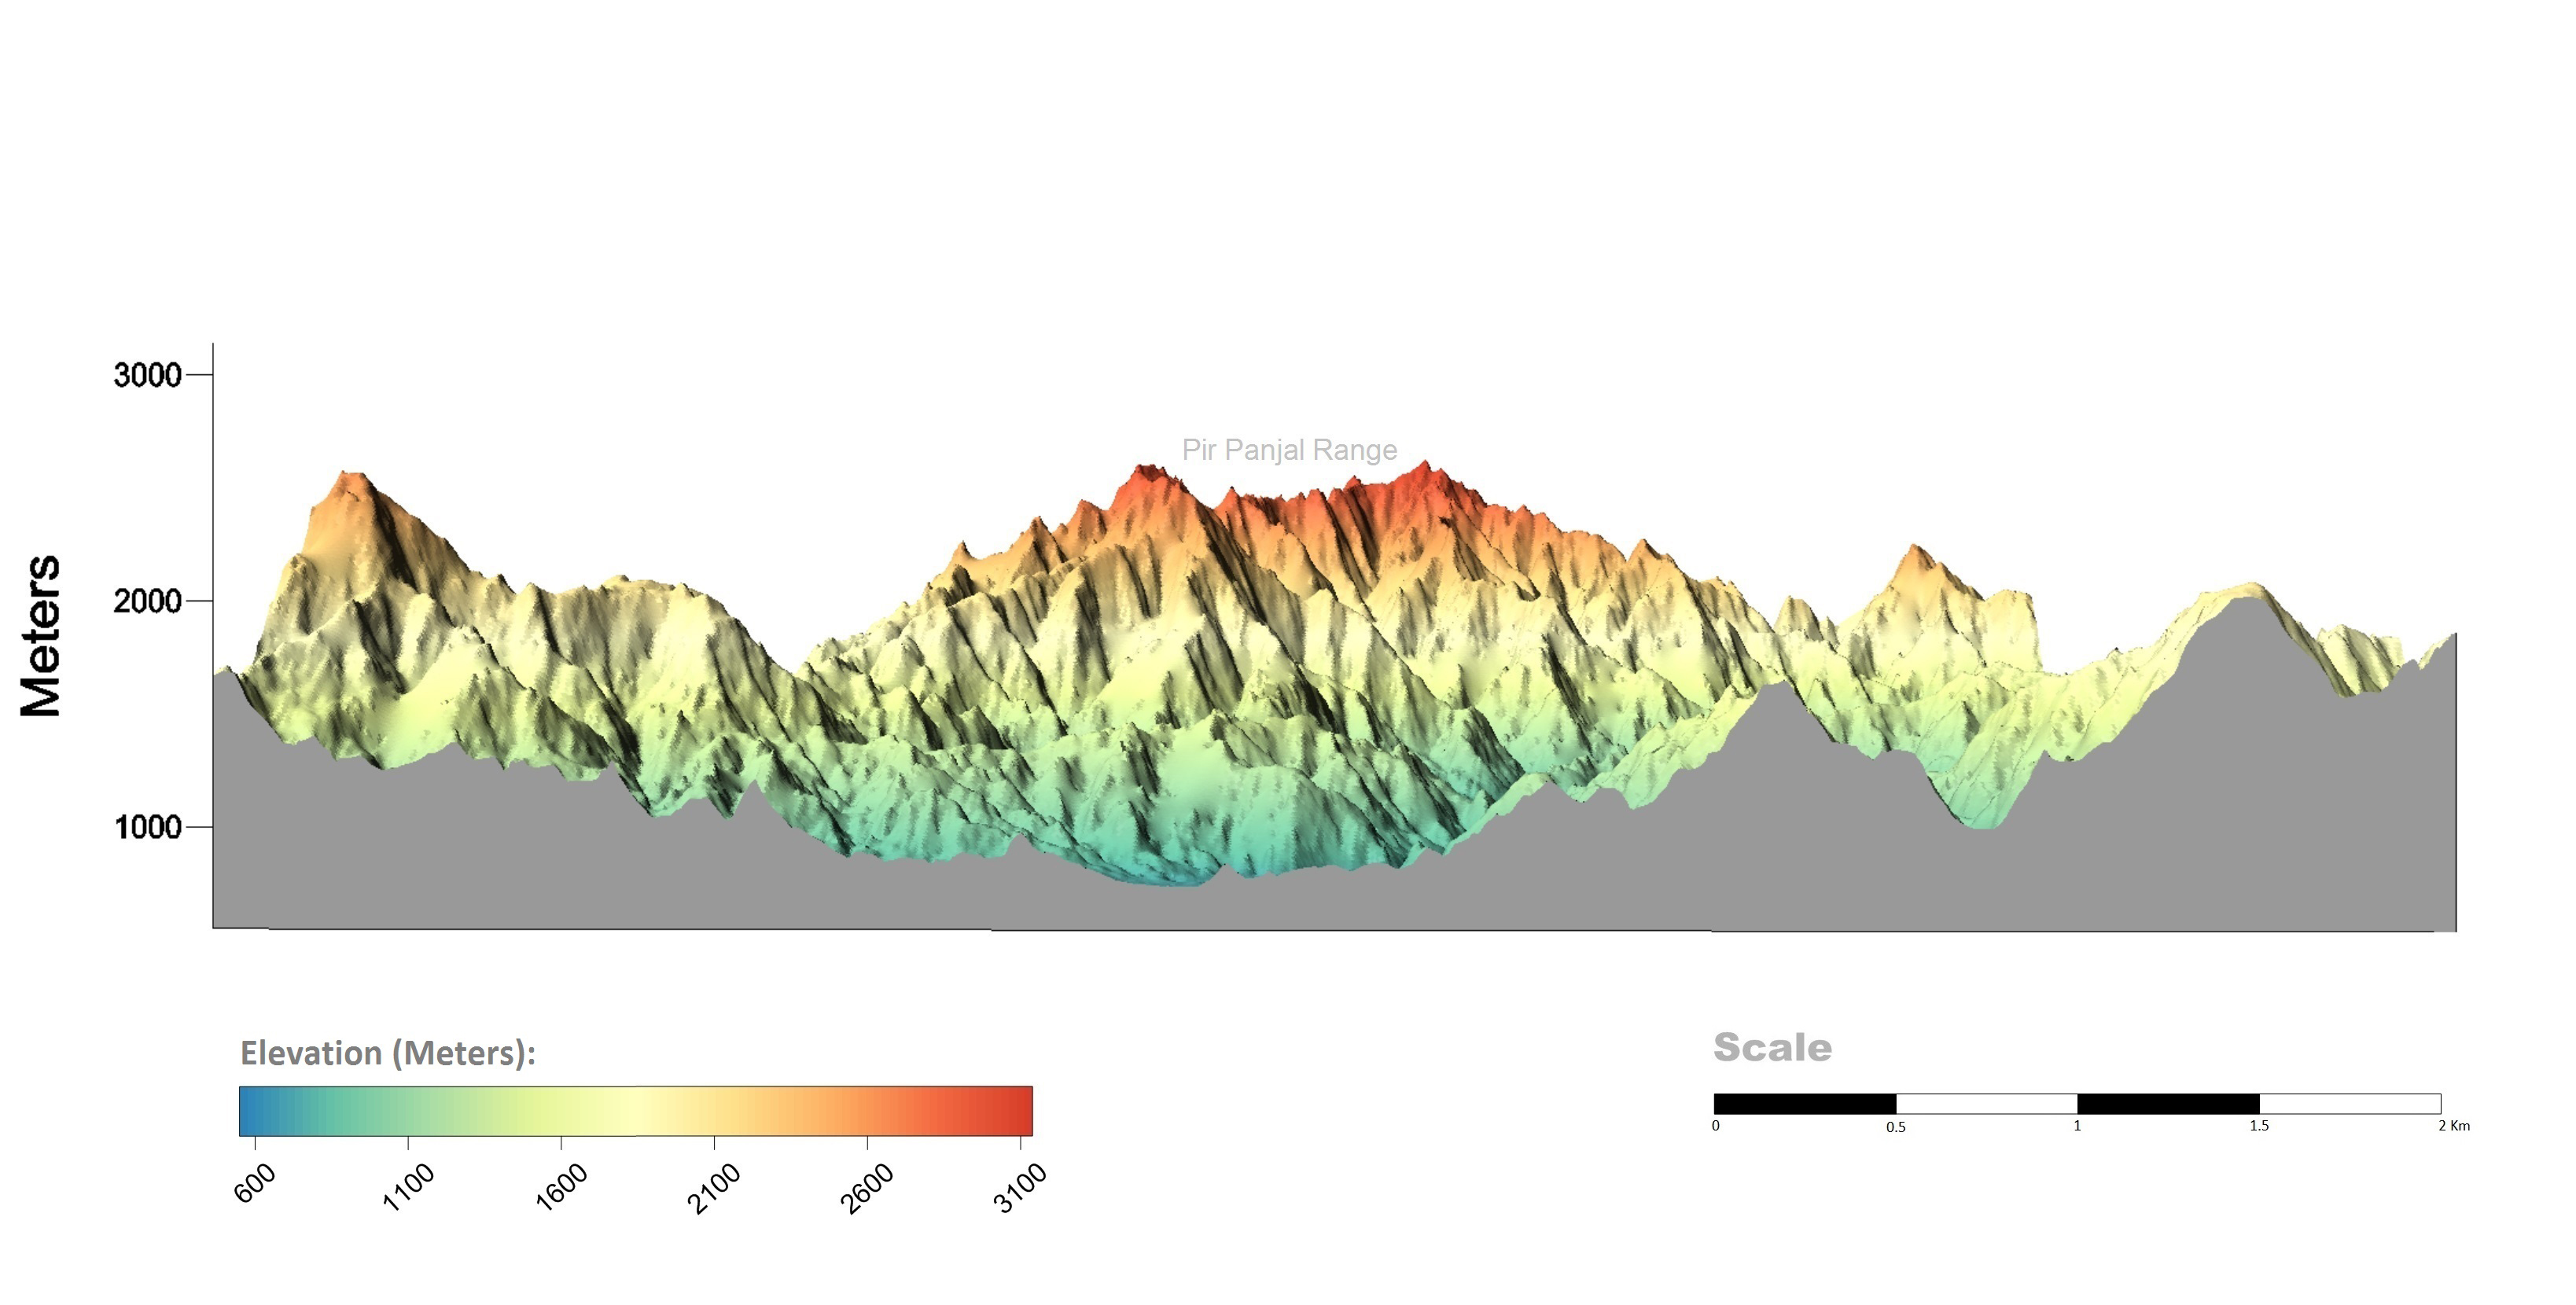
I have searched Grids and Graticules option in ArcScene 10.3 but didn't found there. I am specifically interested to mark Y-axis (as in below map I've prepared in Surfer) to show vertical values of my DEM. How would I do this in ArcScene?
- Mark as New
- Bookmark
- Subscribe
- Mute
- Subscribe to RSS Feed
- Permalink
Well height, in a distance perspective view like ArcScene is somewhat false.
You can't actually insert grids / graticules into ArcScene like you can do in the normal top down, planimetric view of ArcMap.
What I have done in the past is to create a grid of polylines and use that to provide a visual reference.
If you don't know how to use python to create features on a regular grid, see the Create Fishnet tool,
Then you could use this set at various heights to give you the visual reference you require.
- Mark as New
- Bookmark
- Subscribe
- Mute
- Subscribe to RSS Feed
- Permalink
Oh, and that's the Z axis btw.
- Mark as New
- Bookmark
- Subscribe
- Mute
- Subscribe to RSS Feed
- Permalink
I have used Fishnet to place it on planimetric view in ArcMap and overlaid it in ArcScene by converting it in 3D, but it is not appealing at all. You know, I am working to get Z values (Y xis) which you have rightly indicated is absent. I think there would be such facility available in ArcScene in its new version.
- Mark as New
- Bookmark
- Subscribe
- Mute
- Subscribe to RSS Feed
- Permalink
Maybe there is in ArcGISPro, but I havn't looked at that yet.
- Mark as New
- Bookmark
- Subscribe
- Mute
- Subscribe to RSS Feed
- Permalink
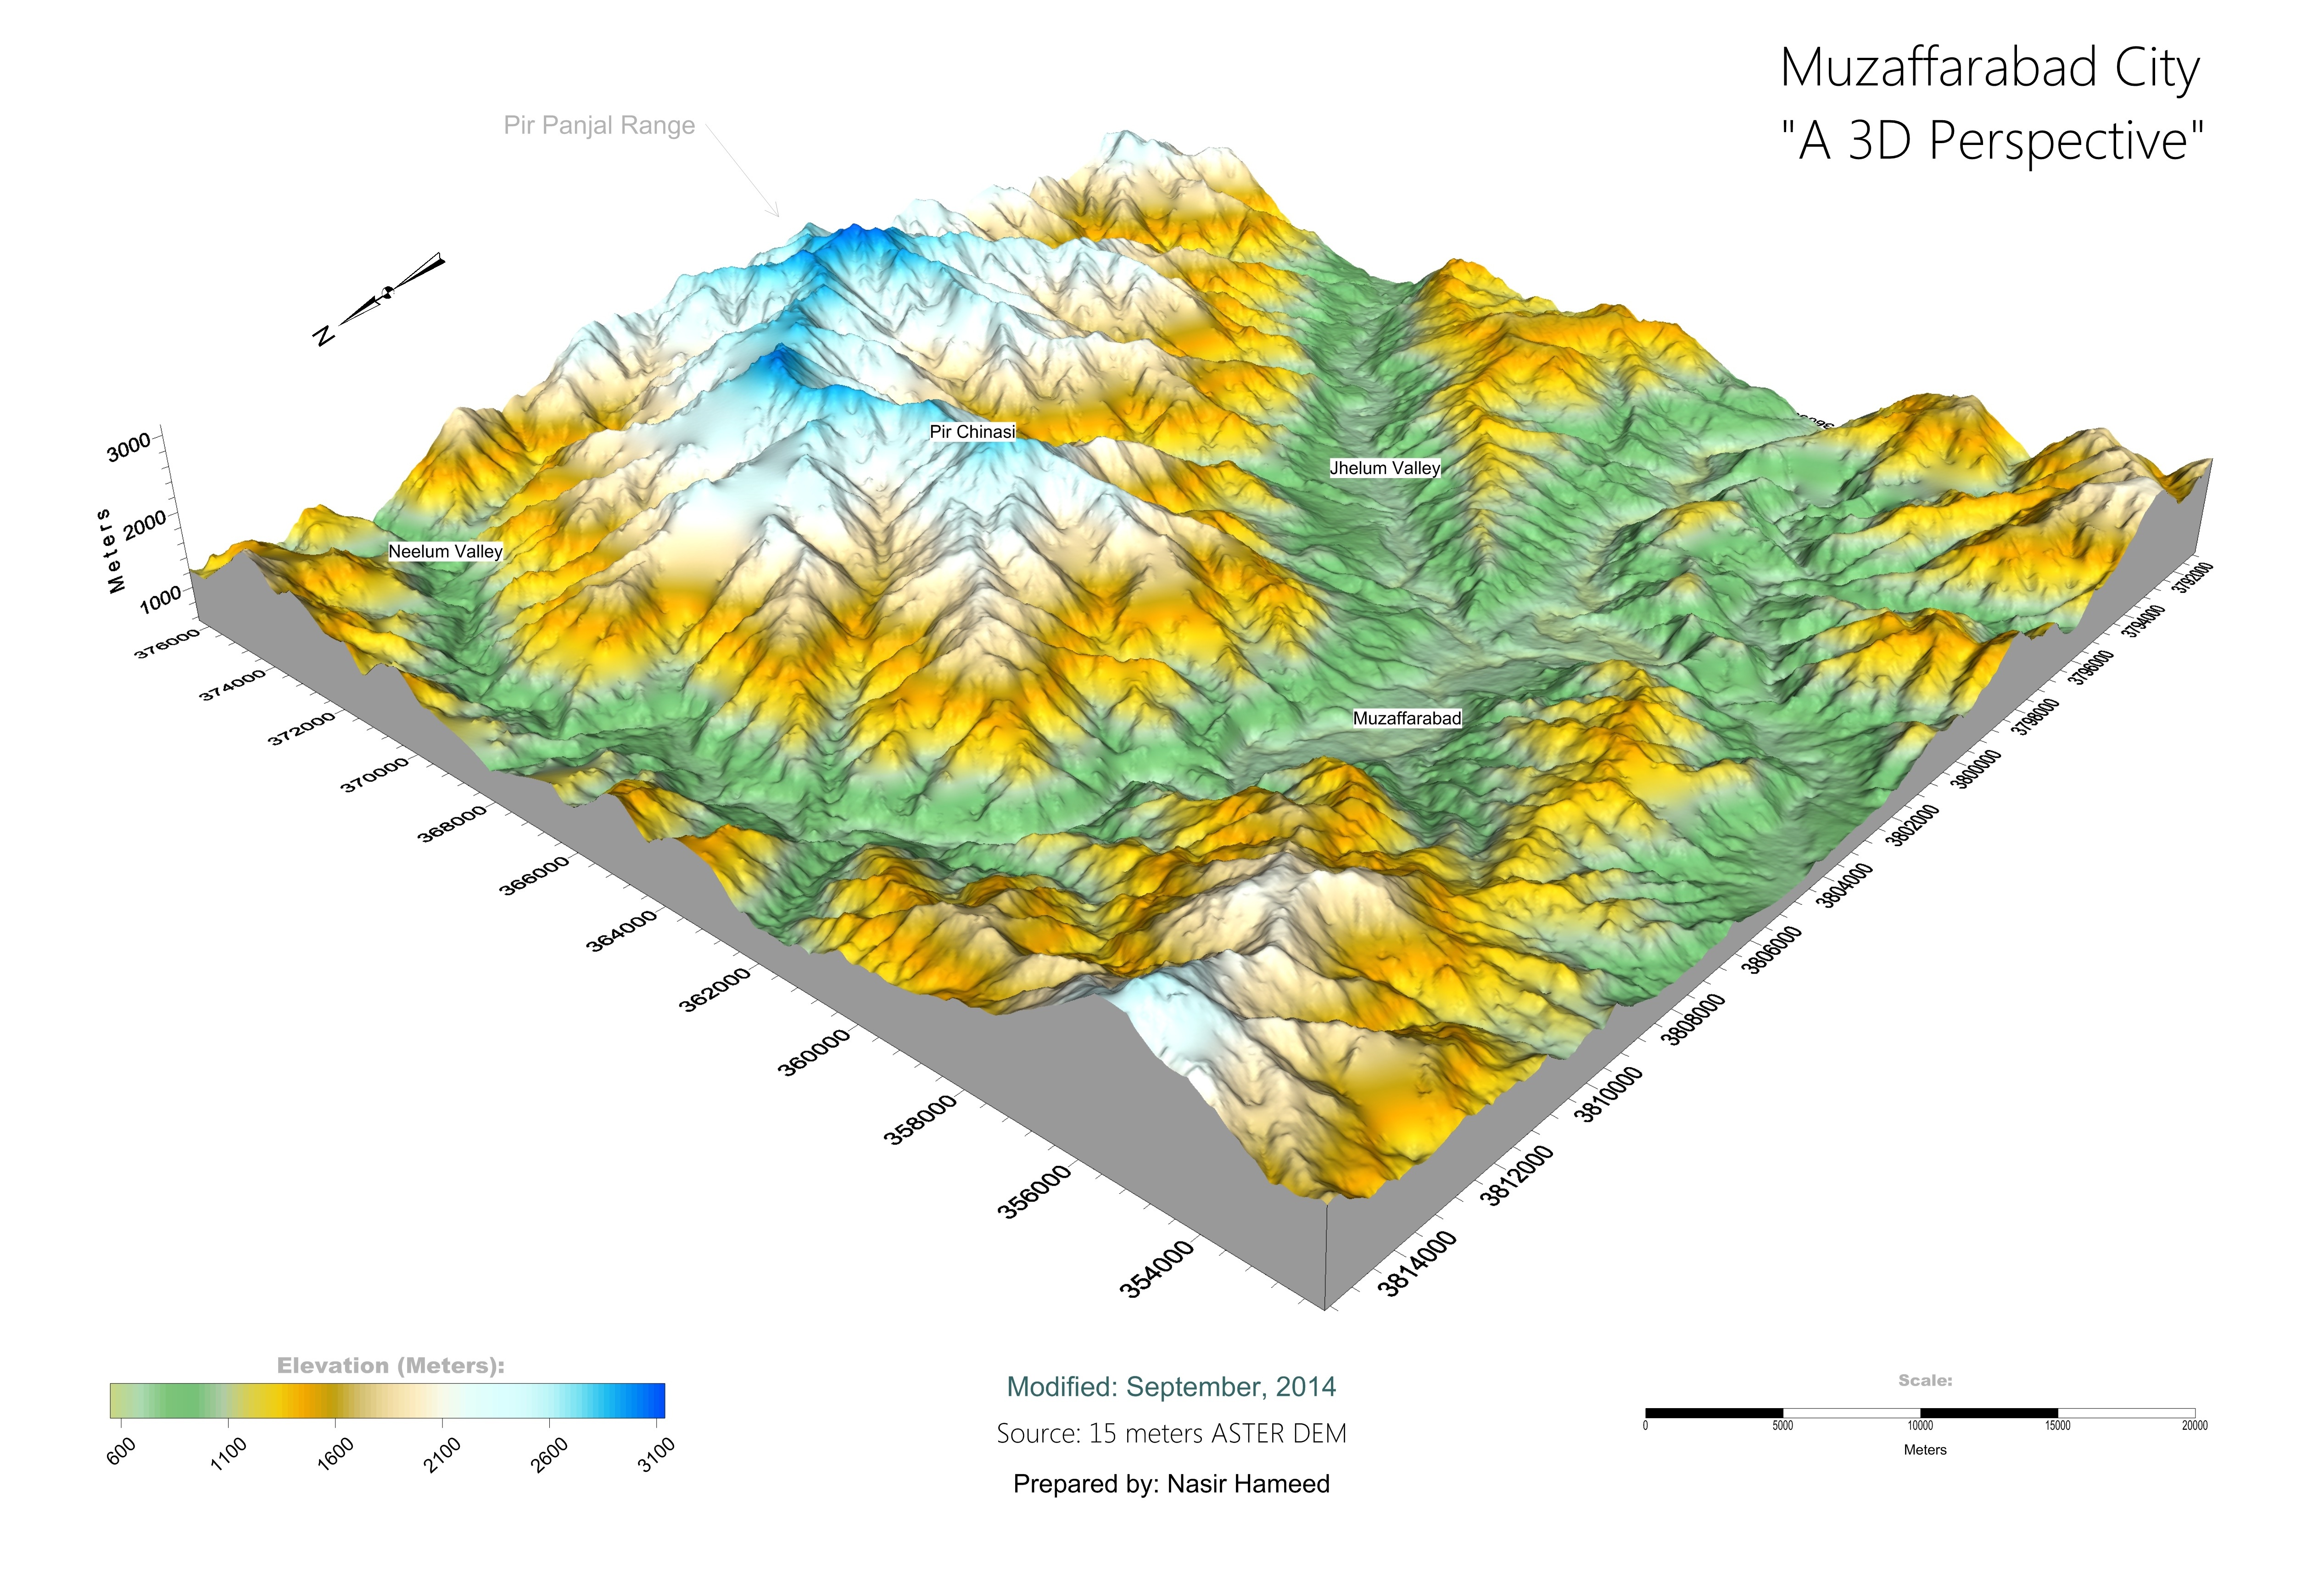
I think next version of ArcScene would be equipped to facilitate users regarding composition of their perspective view. Currently, I do not see 'layout' option there. Consequently, you cant insert legends, grid and graticules, scalebar etc. Although, these options are much common in other GIS software.
- Mark as New
- Bookmark
- Subscribe
- Mute
- Subscribe to RSS Feed
- Permalink
They're not there because a view in ArcScene is not "a map". It is a 3d visualization. As such, scale bars and other layout elements are never actually true but vary across the image depending on the perspective. Most snap shots of 3d scenes make for poor visualization anyway, and only become meaningful either "live" by viewing the data in Scene itself, or by creating a movie using a fly through or create a 3d web scene.
- Mark as New
- Bookmark
- Subscribe
- Mute
- Subscribe to RSS Feed
- Permalink
I am agree with your perception with respect to scale distortions, but in many cases the availability of such tools helps a lot. E.g, have a look on the below map where I have finalized the layout settings in Microsoft Power Point including legend. Here legend helps to easily interpret the view with respect to land cover.
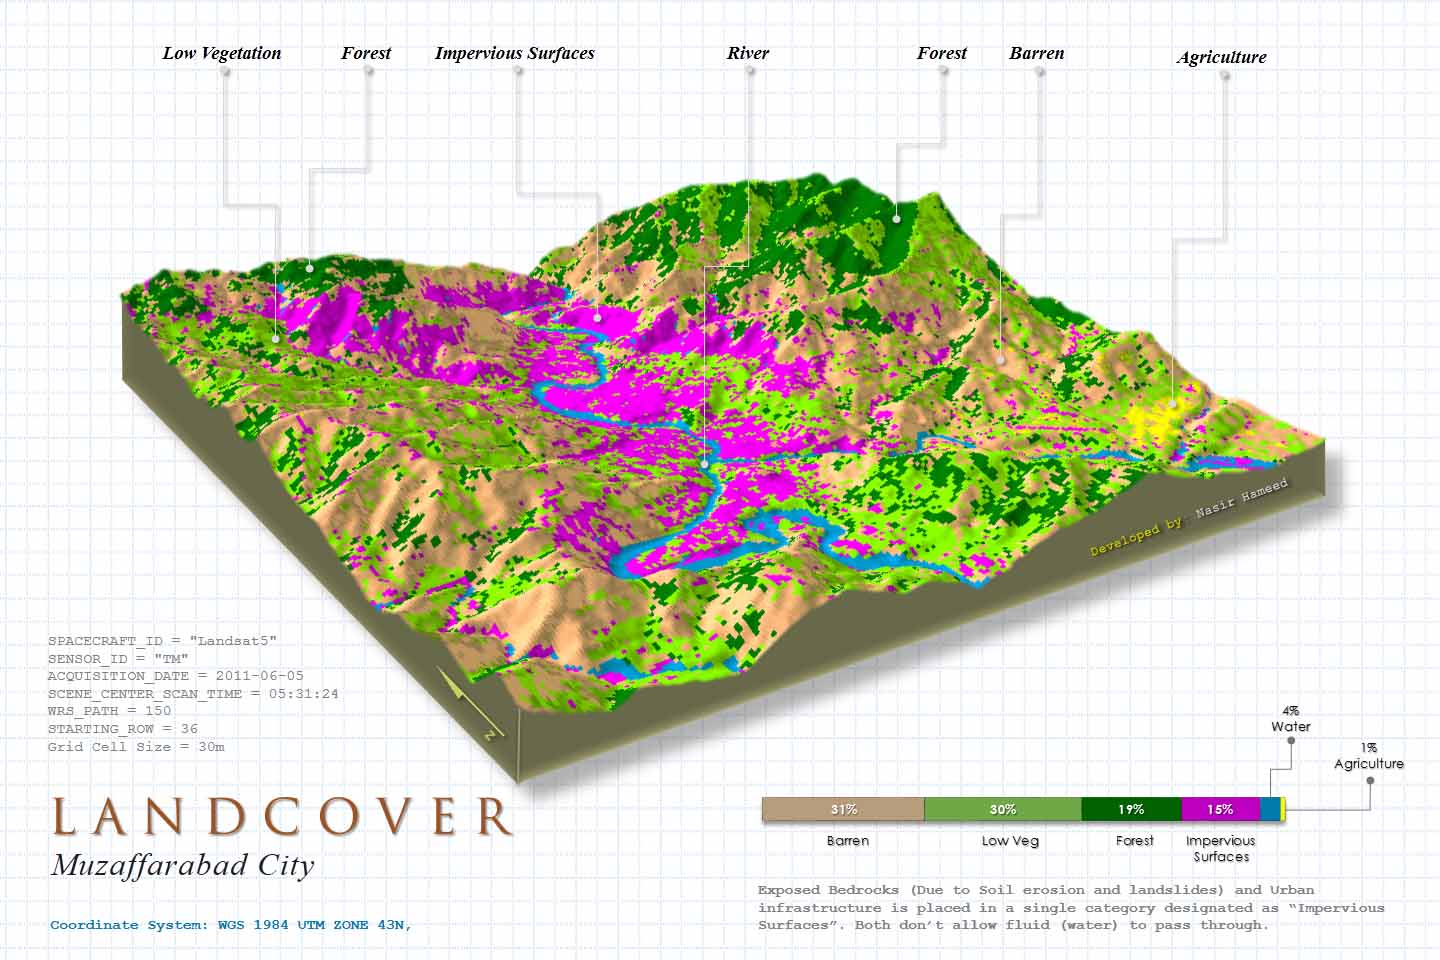
Although, I didn't include scale which was not important in this case.
- Mark as New
- Bookmark
- Subscribe
- Mute
- Subscribe to RSS Feed
- Permalink
and this one I have prepared in Surfer due to nonavailability of said facilities in ArcScene.
The scalebar and color ramps, X and Y axis label etc really make difference.
- Mark as New
- Bookmark
- Subscribe
- Mute
- Subscribe to RSS Feed
- Permalink
Very nice Nasir.