- Home
- :
- All Communities
- :
- Products
- :
- ArcGIS Dashboards
- :
- ArcGIS Dashboards Ideas
- :
- Operations Dashboard - Scale on serial chart
- Subscribe to RSS Feed
- Mark as New
- Mark as Read
- Bookmark
- Follow this Idea
- Printer Friendly Page
Operations Dashboard - Scale on serial chart
- Mark as New
- Bookmark
- Subscribe
- Mute
- Subscribe to RSS Feed
- Permalink
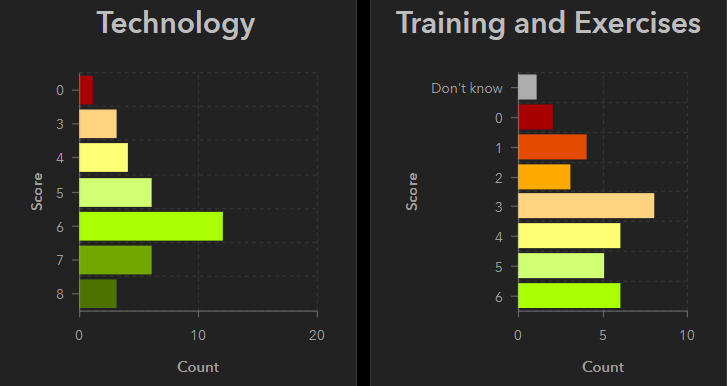
Please add an option to set the minimum and maximum values for the Category Axis on a serial chart. Currently, the chart scale is set automatically by the data, however if you are graphing more than one layer on adjacent charts, the Category Axis is likely going to have different scales, making a visual comparison very difficult.
Minimum and Maximum value option is provided for the Values Axis, and this functionality could be copied.
Thank you!
I second that. Frustrating.... Tried utilising override function for category axis but to no effect. By default it appears categories with no values will not be shown on the category axis and this can not be changed.
I am a little unclear on the ask here. If it is to ensure that all possible categories appear along the category axis (and simply have 0 value), it could be done with a data expression that returns a featureSet containing the data points to be displayed on the chart.
Closing due to inactivity. An example of what a data expression might look like that 'preserves' categories after being filters might look something like the following. The result of this data expression could be the data source for a serial chart that gets its categories from 'Features'.
//Create an array of all the possible category values.
var featSet = FeatureSetByPortalItem(Portal("https://www.arcgis.com"),   "0047d80c5d144fa2b46b88320b008dd6",  0, ["OBJECTID", "DIV_NAME"], false);
var stat = {name: 'Total', expression: 'OBJECTID', statistic: 'COUNT' };
var allCategories = OrderBy(GroupBy(featSet,"DIV_NAME", stat), "DIV_NAME");

//Create a filter that will mimic the scenario where some categories
//are not present in the data being displayed on the dashboard
var someCategories = OrderBy(GroupBy( Filter(featSet, 'OBJECTID < 141183'), 'DIV_NAME',  stat),'DIV_NAME');

//The following should be ok on a small to medium number of categories.
//Loop through all the categories. At each step, look for the corresponding DIV_NAME in the subset of categories to get the total
var outFeatures = [];
var outFeature;
for (var allFeat in allCategories) {
  var div_name = allFeat.DIV_NAME;
  var total = 0;
  for (var someFeat in someCategories) {
   if (someFeat.DIV_NAME == div_name)
   {
     total = someFeat.Total;
     break;
   }
  }
  outFeature = {
    attributes: {
      DIV_NAME: div_name,
      Total: total
    },
  };
  Push(outFeatures, outFeature);
}

//Return a featureset
return FeatureSet({
    fields: [
        { name: 'DIV_NAME', type: 'esriFieldTypeString' },
        { name: 'TOTAL', type: 'esriFieldTypeInteger' }
    ],
    geometryType: '',
    features: outFeatures,
});
You must be a registered user to add a comment. If you've already registered, sign in. Otherwise, register and sign in.