- Home
- :
- All Communities
- :
- Services
- :
- Esri Training
- :
- Esri Training Matters Blog
- :
- Mapping Time in ArcGIS 10
Mapping Time in ArcGIS 10
- Subscribe to RSS Feed
- Mark as New
- Mark as Read
- Bookmark
- Subscribe
- Printer Friendly Page
One of the features of ArcGIS Desktop 10.x is the ability to "time-enable" your data. Visualizing how data changes over time provides opportunities for powerful, more in-depth analysis. The example below uses ArcMap to show how to visualize piracy-related incidents that occurred between March, 2007 and February, 2009 in and around the Gulf of Aden. 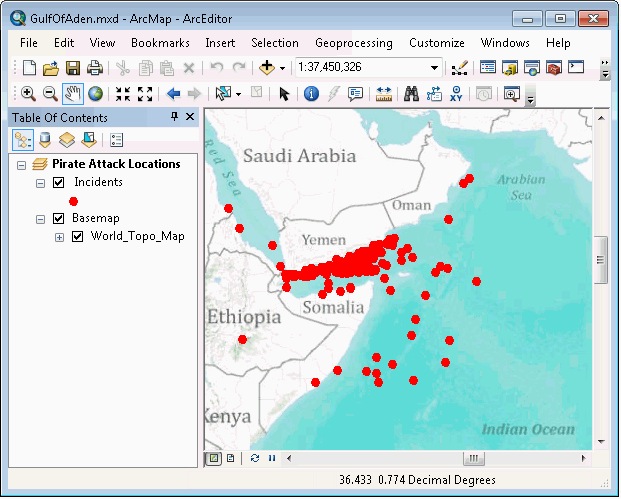
The map document shown on the right includes the World Topographic Map basemap for geographic context, and an Incidents point layer that represents locations where pirate attacks occurred. The Incidents data is a set of Anti-Shipping Activity Messages that was downloaded as a shapefile from the National Geospatial-Intelligence Agency (NGA) Maritime Safety Information portal and loaded into a file geodatabase feature class.
The points on the map reveal the number of attacks that occurred during the time period, and you can see the incident distribution. By time-enabling the incidents, however, you can visualize the progression of the attacks and find out whether there were "clusters within the cluster."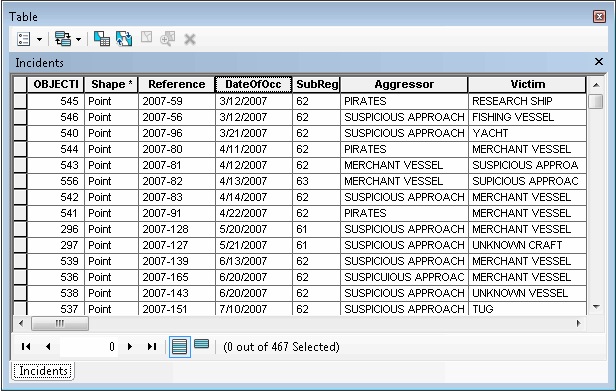
The Incidents layer contains a DateOfOcc attribute, which stores the date (mmddyyyy) that each attack occurred. In order to time-enable a layer, you must have one (or more) fields that stores time data (such as dates). A best practice is to store time data in a date field, but numeric or text fields will also work.
Set Time Properties
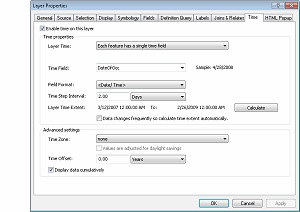
The ArcMap Layer Properties dialog box has a Time tab. So the first step to visualizing the time component of a layer is to simply open the dialog box and click the Time tab. Then follow the steps below:
- Check the box in the upper-left to "Enable time on this layer."
- In the Layer Time drop-down list, choose "Each feature has a single time field."
- For this example, this is the appropriate setting because the attribute table has only one time field. Sometimes, there are two fields that store time data; for example, StartDate and EndDate.
- For this example, this is the appropriate setting because the attribute table has only one time field. Sometimes, there are two fields that store time data; for example, StartDate and EndDate.
- For Time Field, choose the field in the layer that contains your time data. In this case, it's DateOfOcc.
- For Time Step Interval, you can manually set the interval or you can let the software calculate an interval based on your data. In this example, 2 days was specified.
- At the bottom of the dialog box, check the box to "Display data cumulatively."

These settings will draw incidents for each two-day increment and keep earlier incidents displayed as succeeding incidents draw—allowing you to see the pattern of occurrence over the two years spanned by the data.
Time-Enable the Map
- Click OK to apply the layer's time properties, then click the button on the Tools toolbar to open the Time Slider window.
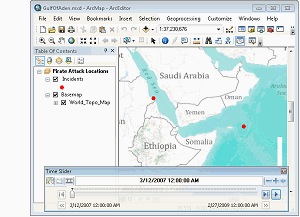 Click the "Enable time on map" button in the upper-left corner of the Time Slider window.
- After clicking this button, only the data associated with the start time displays on the map.
- Click the Play button to see the incidents display in order based on their date of occurrence.

This time visualization reveals that in 2007 there were fewer incidents of piracy, they were much more spread out, and they did not appear to be consistently in close proximity to land. By early 2009, there were significantly more incidents, and they appear to be far more concentrated in the Gulf of Aden, specifically on the Yemen side of the gulf.
The change in incident distribution could be due to an attempt by ships to avoid the Somali Coast. NGA Special Warning Number 123 advises mariners to remain at least 200 nautical miles distant from the Somali Coast.
Sharing Time Visualizations
The time properties are saved with the map document. You can share the time visualization by sharing the map document. But what if the people you want to share with don't have ArcMap?
From the Time Slider window, you can quickly export a time-enabled map to an AVI file, which can be viewed using Windows Media Player.
Knowing where things occur is the cornerstone of GIS analysis. You have to know where before you can hypothesize why. Another dimension to GIS analysis is when. Knowing where and when things occur means you can not only visualize patterns, but how patterns have evolved over time. With this information, you gain a deeper understanding of your data and can better model and predict future patterns.
Related post:
You must be a registered user to add a comment. If you've already registered, sign in. Otherwise, register and sign in.
-
ArcGIS Desktop
28 -
ArcGIS Step by Step
46 -
Class Resources
25 -
e-Learning
64 -
MOOCs
31 -
Software Demos
11 -
Technical Certification
17