- Home
- :
- All Communities
- :
- ArcGIS Topics
- :
- Applications Prototype Lab
- :
- Applications Prototype Lab Blog
- :
- Statistics and query helper add-in for ArcGIS Pro
Statistics and query helper add-in for ArcGIS Pro
- Subscribe to RSS Feed
- Mark as New
- Mark as Read
- Bookmark
- Subscribe
- Printer Friendly Page
What is it?
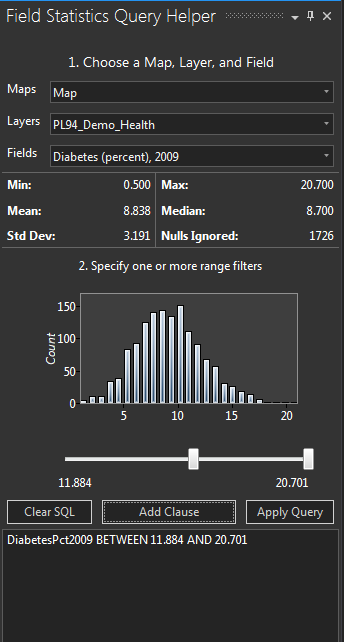
This is an add-in for ArcGIS Pro 1.4. It's a dockable pane that shows basic statistics and a histogram for any numeric attribute in your dataset. It also offers a slider control for selecting and filtering map features on a range of those numeric values.
Why build this?
Quite some time ago, I built a healthcare-oriented Flex app. It let you choose two to four attributes and set a numeric filtering criterion on each, using the drop-down control.
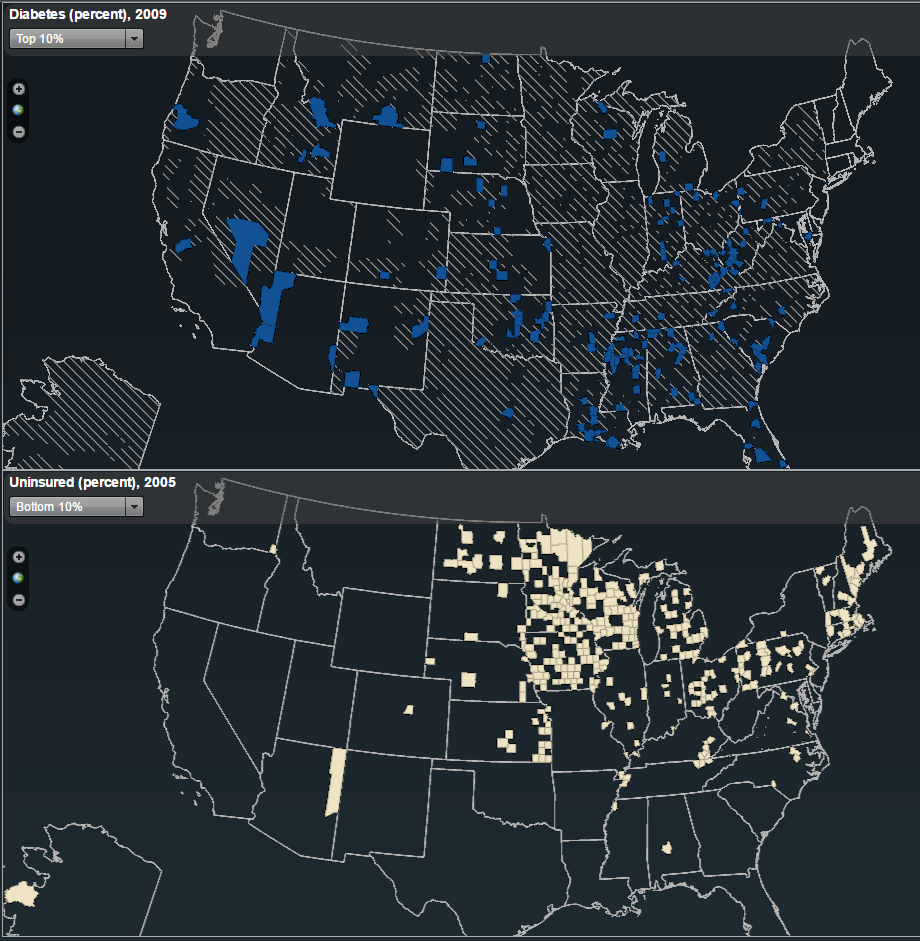
Then the Summary Map button would produce a filtered map with the unioned results of those filters—like a logical "AND" operation. This facilitates exploration of your data set, helping you find, for example, places where diabetes rates are above average and also where uninsured rates are below average.
Now that Flex has come and gone, I wanted to take those capabilities—filtering with a specified range, combining filters together, viewing the data's histogram—to a new platform. Sporting an SDK for extensibility, ArcGIS Pro is Esri's premier desktop application, so I settled on an ArcGIS Pro add-in.
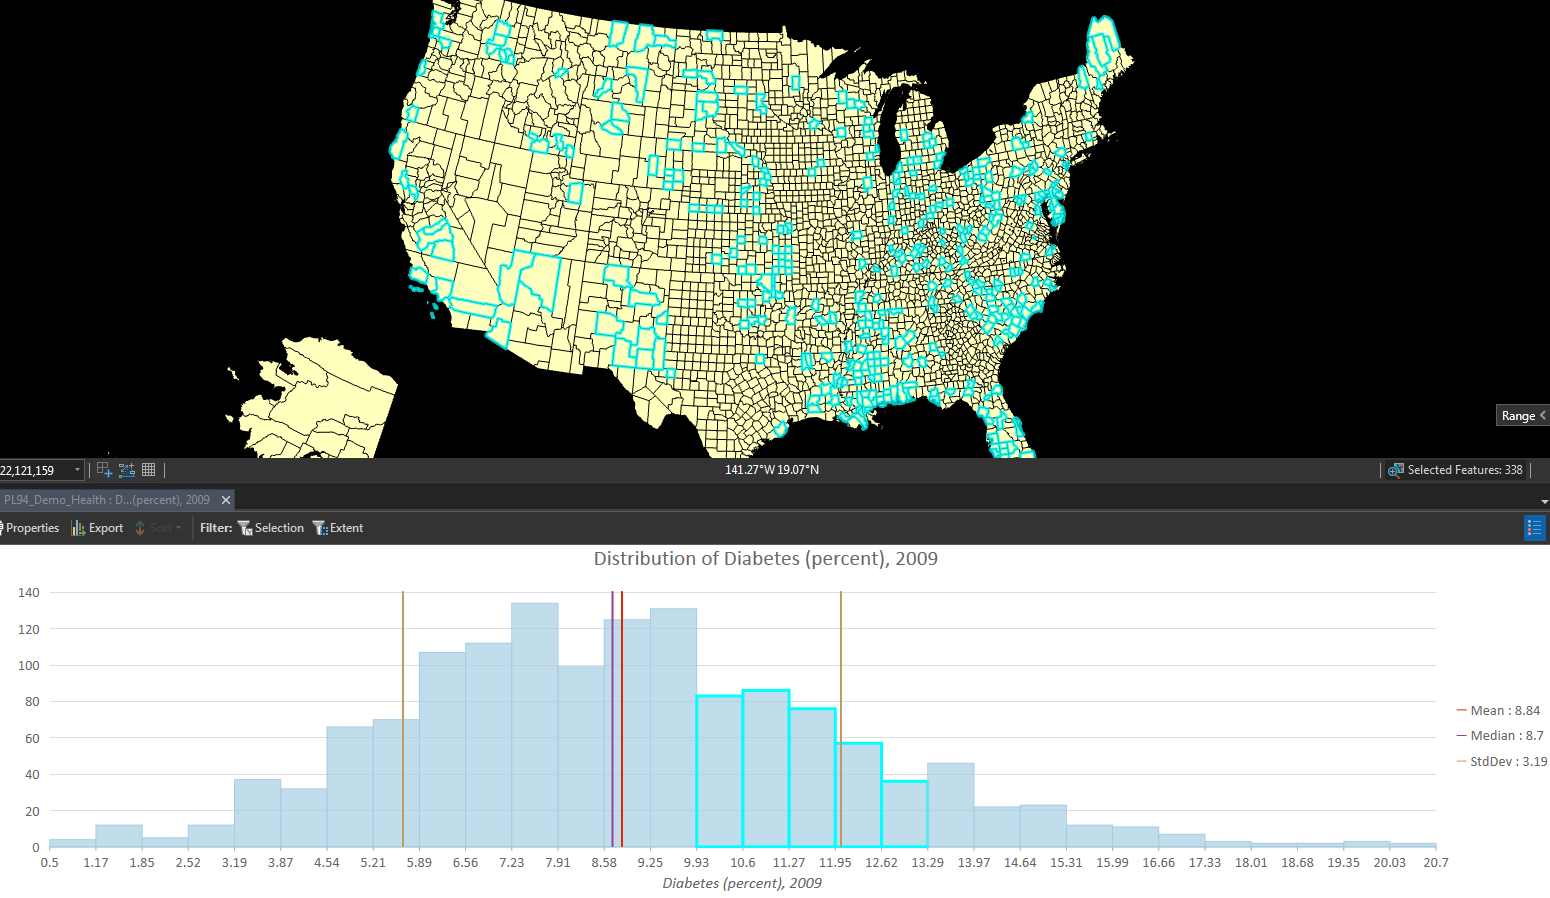
Some searching indicated that all this desired functionality is already available in different places in ArcGIS Pro. A Histogram chart shows the mean and median and a histogram of how the data is distributed throughout its range. There are some pretty neat features here that mirror chart selections on the map and vice-versa. If you create ranges for one or more attributes, you can use the resulting range slider bars to define, apply, and combine filter criteria.
But I wanted all this functionality all together in one place, available with a minimal number of mouse-clicks and dialogs; so I built an add-in to offer it in an ArcGIS Pro DockPane.
To use it
If you want to try it out, here's how:
- Make sure you have ArcGIS Pro 1.4 or 1.4.1 installed.
- Download the add-in file here.
- Double-click the add-in file to install it.
- Start ArcGIS Pro and open a project that has a map and a layer with numeric attributes. Or you can download a sample project here.
- Click the "Query Helper" button in the add-ins tab.
- Select a map, layer, and field; use the track bar control to choose a range of values in that attribute.
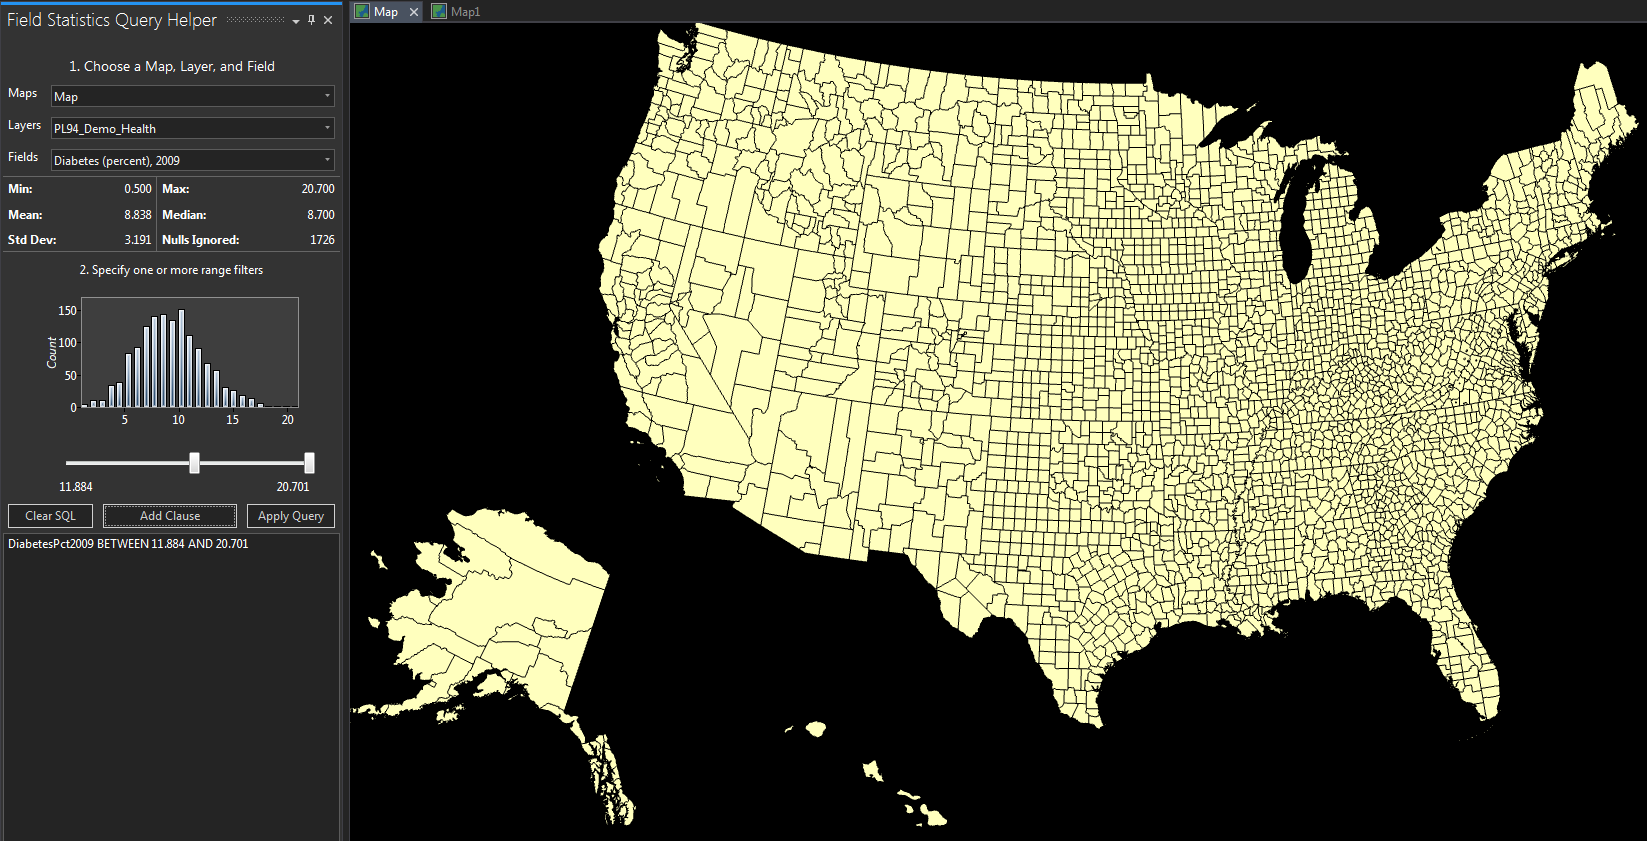
- Click "Add Clause" and then "Apply Query" to filter the features on the map.
- You can add more fields and ranges to the SQL and apply them for an additive effect.
- You can also edit the SQL where clause in the text box if you want to explore your data more directly; if you enter an invalid SQL clause, the map result will be blank--just click Clear SQL and start again.
Challenges and lessons learned while building it
To get started, I tried using the ArcGIS Pro DockPane template for Visual Studio 2015. That created an empty DockPane and button, but didn't give me the guidance I needed to work with the MVVM pattern built into the template. (You may also want to see this Microsoft document on the MVVM pattern.) So I ended up extending an existing Esri community sample that loads maps and bookmarks into a DockPane.
I ran into a few instructive challenges in the process, mostly involving helper libraries and controls, but also matters of display and output.
Math.net
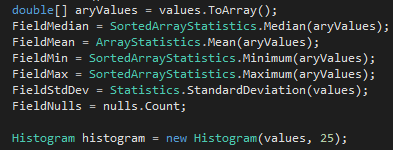 There are lots of statistics libraries available for .NET. I was looking for something simple, reliable, and free. Some research led me to the Math.net package, which I ended up using for statistical computation and creating histogram ranks.
Chart control
Since there's no chart control bundled into .NET, I had to look for one—again, it needed to be freely available. Though documentation is minimal, I went with the WPF Extended Toolkit (available through Visual Studio via the NuGet package system). Discussion of the challenges of using this charting system could fill another blog post or several. I'll just say that Google is your friend here.
Decimal point precision
This add-in needs to work with all sorts of numbers, including floating point values with too many decimal places to display in the available on-screen space. I opted to use StringFormats for limiting displayed decimal places to three (although computations are still done on the original, unrounded values).
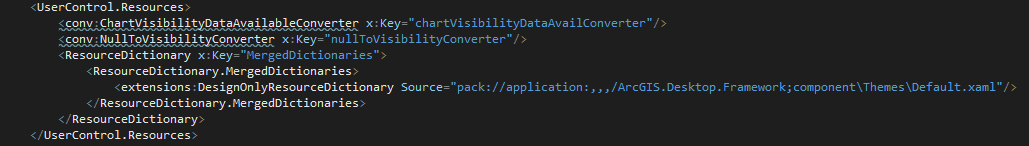
XAML design mode
I also needed a way to hide the statistics field and histogram when an attribute field wasn't yet chosen and there was no data to display. I did this with a ValueConverter. The suggested way to declare ValueConverters is as static resources in the XAML file; unfortunately, this led to another problem I still don't have a proper fix for. The resource declarations seem to confuse the visual editor into displaying only an error message. My workaround was to remove the static resource declarations for those rare occasions I wanted to use the design view; then pasting those declarations back in before building the project.
Next steps
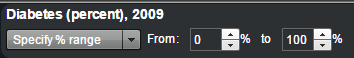
There's still more to be done. Now that I have a basic level of functionality, I want to add the different range-specification options available in the original Health Indicators Flex app: things like top/bottom X% and choosing a given range of percentages.
Resources
Add-in
http://apl.maps.arcgis.com/home/item.html?id=3f7b7d203b164304989adb88ebf88ed0
Sample data
http://apl.maps.arcgis.com/home/item.html?id=8c14e8d211ee4601a2f085aa1d8094de
Source (GitHub)
https://github.com/markdeaton/pro-addin-field-stats-helper-cs
You must be a registered user to add a comment. If you've already registered, sign in. Otherwise, register and sign in.