ArcGIS Enterprise Logs and System Log Parser
While several Community Articles exist which discuss analyzing ArcGIS Enterprise logs and how to get started with System Log Parser:
There are few resources that go into the details of the generated spreadsheet report and how to make GIS administrator and/or developer decisions based on the performance information it provides.
This Article will walk-through how to perform some log analysis on a Utility Network deployment which can then be used to build knowledge about Site usage and efficiency.
Performance Analysis of ArcGIS Enterprise Logs
Before jumping in, let us review what log analysis is and where such log data can be found in an ArcGIS deployment.
Log Analysis:
The process of extracting information from log data. This information can be used to quantify GIS usage and help answer:
- What services are users asking for?
- What operations are they performing?
- What performance are they experiencing?
Log Data:
The log data to analyze is the ArcGIS Enterprise logs. Typically, this data resides on the deployment servers and comes in different forms:
- ArcGIS Web Adaptor access logs
- The log data source used in this Article
- ArcGIS Server access logs
- ArcGIS Pro generated logs
Each log source offers its own wealth of information.
Example Scenario for Log Analysis
The following scenario is the use case for our log analysis:
Your manager has assigned a task:
Quantify the ArcGIS Utility Network usage and efficiency of your Site
This means, the following will need to be answered:
- Is the Site well managed and optimal?
- What services are the most popular?
- Which methods are called?
- query, applyEdits, updateSubnetwork
- How are services performing?
- Overall user experience?
Our manager has also asked that such analysis needs to be carried out in a cost effect manner.
Note: Before the log analysis is started, it is recommended to reference any performance targets that may already exist for your organization. Such criteria may state what performance is expected for specific operations, for a given period of time. This can help you answer how your services are performing with respect to your deployment.
Why Perform Log Analysis?
We have our task at hand, but why go through the logs? Why perform log analysis?
In order to recognize Site usage and efficiency of the Utility Network deployment, a proven strategy is to understand request performance and utilization through the logs.
There are several benefits with this approach:
- Easy to do
- Performed quickly
- Very likely that data already exists to analyze
- Read non-invasively
- Can have minimal cost to server resources
ArcGIS Enterprise logs (ArcGIS Web Adaptor access logs or ArcGIS Server logs) can provide a valuable record of client requests and server responses. This data is a powerful and accurate view of the past.
How to Accomplish the Analysis?
The strategy for this analysis is straight-forward:
- Consume the deployment logs
- Extract request information
- Generate statistics on the service and function performance
Log data can be read and analyzed quickly using a free utility: System Log Parser
System Log Parser is tool for digesting logs that can be run via a graphical user interface (GUI) or command-line (for automated scripting). It is compiled for the Windows platform.
Log Analysis Strategies
Which log source should be used for the analysis?
Several source options may exist for a deployment:
- ArcGIS Enterprise
- ArcGIS Web Adaptor access logs
- Microsoft Internet Information Services (IIS)
- Apache Tomcat
- Cloud
Accessibility options may also exist:
- Web access
- Local network access
- Local file system access
Each log source has unique strengths and while several log sources might exist for a deployment, it is recommended to pick one and use that for the primary analysis (e.g., ArcGIS Web Adaptor access logs).
For this Article, reading the ArcGIS Web Adaptor access logs over the local network will be the source of the data.
Note: Most log formats are operating system agnostic and standardize the data columns. ArcGIS Server logs follows this pattern.
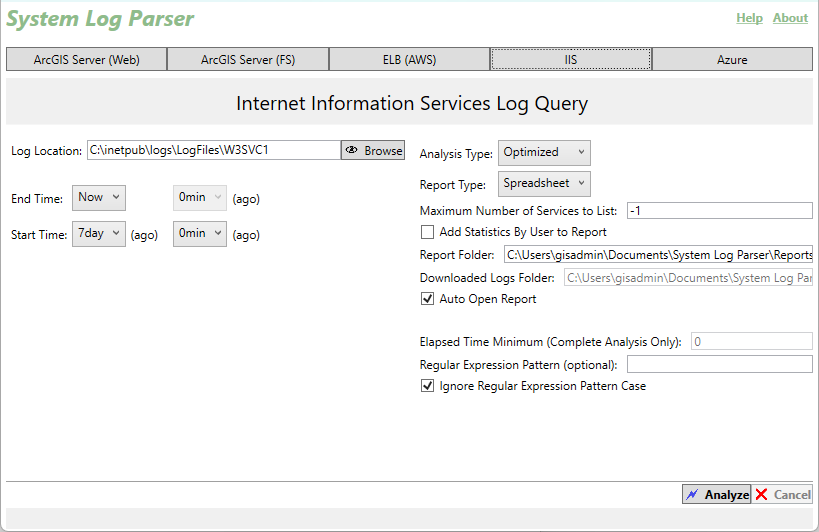
Running System Log Parser
Graphical User Interface
Easy to use and configurable.
Options:
- Choose log source
- Internet Information Services Log Query
- Set log location path
- Local: C:\inetpub\logs\LogFiles\W3SVC1
- Could also specify a shared network location: \\server1.yourdomain.org\w3svc1
- Set Date range
- Set Analysis Type to Optimized (the Default)
- Fast and memory efficient on machine running System Log Parser
- Analyze logs!
Command-line Automation
Same functionality as GUI but a little more flexibility. Ideal for generating automated reports periodically (e.g., a Windows Scheduled Task).
PowerShell Example:
- Choose log source
- Set log location path
- Local: C:\inetpub\logs\LogFiles\W3SVC1
- Could also specify a shared network location: \\server1.yourdomain.org\w3svc1
- Set Date range
- Time in UTC
- Can pass in a specific datetime value
- -startstring "[Start_DateTime_UTC]"
- -endstring "[End_DateTime_UTC]"
- Set Analysis Type to Optimized
- Analyze logs!
PS C:\> # Run System Log Parser via PowerShell
PS C:\> $startLocal = $endLocal = Get-Date # Now
PS C:\> $startLocal = $startLocal.AddDays(-7) # Go back 7 days ago
PS C:\> $startUtc = $startLocal.ToUniversalTime().ToString("yyyy/MM/dd h:mm:ss tt")
PS C:\> $endUtc = $endLocal.ToUniversalTime().ToString("yyyy/MM/dd h:mm:ss tt")
PS C:\> $iisLogPath = "C:\inetpub\logs\LogFiles\W3SVC1" # Could also be \\server1\W3SVC1
PS C:\> $reportDate = $endLocal.ToString("yyyyMMddTHHmm")
& "C:\SystemLogParser\slp.exe" -f IIS -i "$iisLogPath" -startstring "$startUtc" -endstring "$endUtc" -a Optimized -d "C:\MyReports" -n "SLP_IIS_Optimized_$reportDate.xlsx" -o falseNote: If the size of your log data is unknown, it is recommended to start with a smaller query window (e.g., 1hr or 6hrs) until a relative compute time is understood.
The Log Report -- Understanding System Log Parser output
By default, the generated report is spreadsheet-based. It creates an XLSX file which is an Open Office XML document. The report typically consists of several worksheets, each of which summarizes a particular metric.
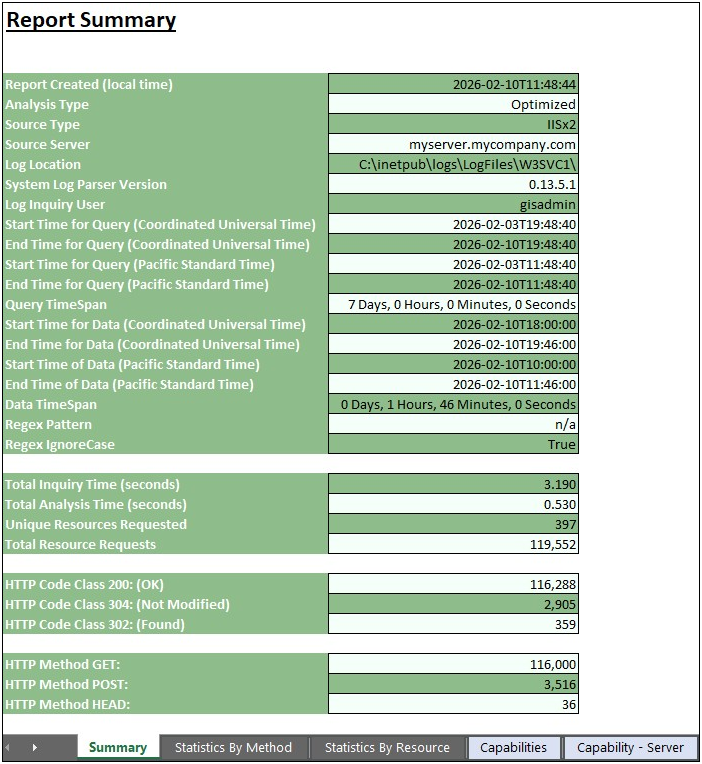
Summary Worksheet
The initial page lists some information detailing:
- The date the report was generated
- The analysis type of the report
- Specified log path
- Start and End times
- High level log query and request statistics
Statistics By Method Worksheet
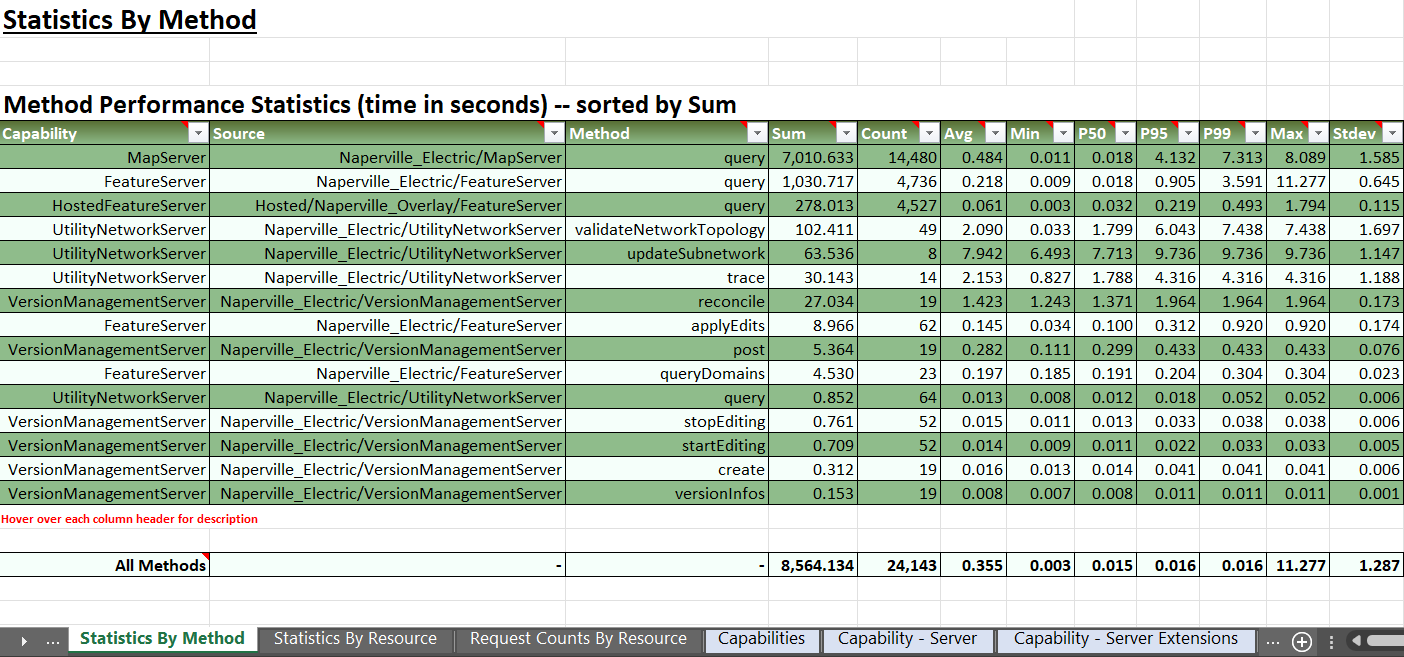
The Statistics By Method worksheet is a breakdown of requests and responses per function that help answer some of the primary questions of the task:
- Which methods (also referred to as functions or operations) were called?
- query, applyEdits, updateSubnetwork?
- How were services performing?
The table on this worksheet provides a great deal of information. The default view sorts the columns of time by largest Sum value. Sum is derived from the "request occurrence (Count column) * average response time (Avg column)", which highlights the service and operation the servers spent the most time on to fulfill responses.
Note: Response times shown for demonstration purposes only. Response times for each deployment are unique as performance is influenced by many factors.
Note: Tabular data view for actual deployment may be much larger with more services and additional functions reported.
In addition to Sum, Count and Average, the following statistics are displayed to help provide a deeper understanding on how the services and functions are performing:
- Min
- Minimum, the least or fastest response time value observed for that function (from that service source)
- P50
- The 50th percentile; 50% of the response time data for that function (from that service source) fall at or below this point
- P95
- The 95th percentile; 95% of the response time data for that function (from that service source) fall at or below this point
- P99
- The 99th percentile; 99% of the response time data for that function (from that service source) fall at or below this point
- Max
- Maximum, the highest response time value observed for that function (from the service source)
- Stdev
- Standard deviation, a calculation on the spread or variation of the response times for that function (from that service source)
The table highlights that the query function was the most popular method requested. By deployment compute time, the top three operations were actually all query (e.g., MapServer, FeatureServer, and Hosted) across two different services (Naperville_Electric and Naperville_Overlay).

Looking at the Avg column, the average response time (in seconds) of these query functions are summarized and all three were sub-second (meaning less than 1 seconds).
With the query methods being identified, scanning the table for other functions of interest showed applyEdits and updateSubnetwork were also called.

Looking at other functions of interest, we can observe applyEdits and updateSubnetwork. On average, applyEdits had sub-seconds response times and updateSubnetwork took several seconds.
- This table helps answer the question of which methods were called
- A performance profile for three different queries was found along with applyEdits and updateSubnetwork
- Other functions were present like trace, reconcile, and post
- As for how the two reported services were performing, the definitive answer to this question can vary by organization:
- Typically based on existing performance criteria for the service, function and metric
- Initial runs of System Log Parser will yield an understanding of the current timeframe selected
- This should provide a good overall sample
- Running System Log Parser on a regular basis will allow you to compare changes in performance profiles
- If unusual behavior is observed in subsequent reports, an investigation or review or may be required
Note: Typically, not all methods follow the same performance criteria. Each function performs different work than others. A feature query would have a different performance profile than updateSubnetwork.
Request Counts By Resource Worksheet
The Request Counts By Resource worksheet is an easy view on which services were the most popular. The totals are separated into two groups:
- Resource Requests (method based requests)
- Lists counts based on requests that used known service functions (similar totals to the Statistics By Method worksheet)
- Resource Requests (method and service endpoint based requests)
- Lists counts based on requests that used known services functions and requests to the REST service endpoints that typically pull metadata (similar totals to the Capability - Server worksheet)
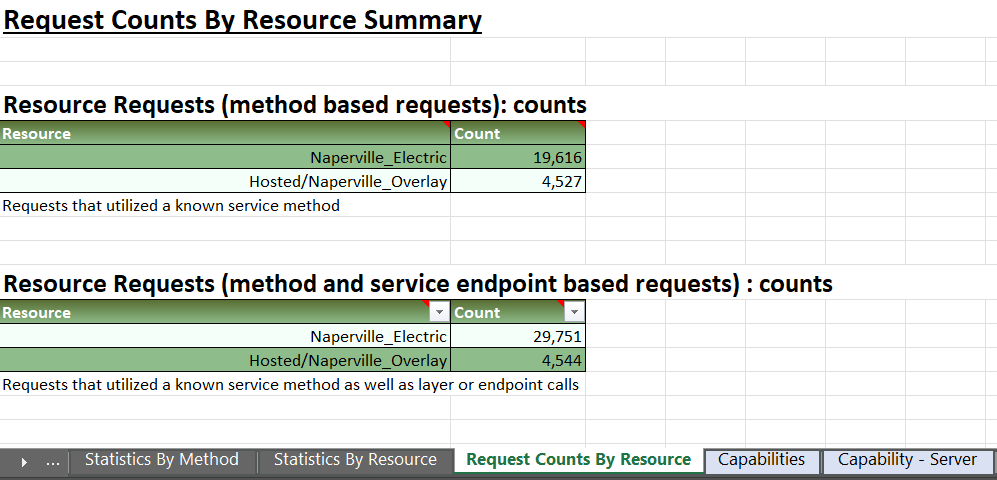
This table can help answer the remaining questions of the task:
- What services are the most popular?
Based on the Source and Total columns, we can see that Naperville_Electric the most requested resource.
Capability - Server Worksheet
The Capability -- Server worksheet is alternative view to assessing service performance. It lists the breakdown by Capability and Source, but method is removed. Without the separation by method, the total number of requests for many of the services is higher. This is because there can be requests for a service that do not call a function. Some requests just make calls to the service's or layer's metadata.
Instead of a statistical view of request performance, the times are grouped into response time buckets. These buckets consist of a duration range (e.g. 0-1 seconds or 6-10 seconds). This simplified view can make it easy to see where time is being spent.
In the following example, there are two buckets of time that are highlighted. While these represented a small percentage of the overall number of MapServer requests, they highlight a tuning opportunity for the GIS administrator and/or developer who can decide if the amounts and values were acceptable.

Note: Response times shown for demonstration purposes only. Response times for each deployment are unique as performance is influenced by many factors.
This table can help answer the remaining questions of the task:
- Is the Site well managed and optimal?
- Overall user experience
A well managed and optimal Site implies:
- The majority of the operations performed were fast or within the range deemed good/acceptable
- "Fast" and "within the range" are subjective quantifications and are best answered by preexisting performance criteria from your organization
- Another perspective, is using your best judgement from experience
- A small number of requests in the larger time buckets indicates there are some longer running functions
- Perhaps this can be tuned
- Function input (e.g., the parameters of the request) can also be a factor
- If the services are dedicated (as is with Utility Network services) and they are configured with the appropriate number of instances
- Configuration tuning could be eliminated
The overall user experience:
- Is related to the functions exercised and their respective performance profile
Note: There are several factors that can play a part in service performance:
- Number of instances
- Only available with dedicated services
- The data
- The methods called
- As well as parameters used
- Deployment architecture
- Available hardware resources
- Demand (e.g., concurrent requests)
Tuning these characteristics to adjust performance is outside the scope of this Article.
Log Report
The generated log report made it easier to answer the questions for the task.
What services were the most popular?
- Naperville_Electric was the most popular followed by Naperville_Overlay
What functions were called?
- Many different methods were called: several spatial queries, applyEdits, updateSubnetwork, trace, validateNetworkTopology, reconcile and post.
How were the services performing?
- Ultimately, this definition can vary by organization
- It is typically based on a criteria or agreement that lists an expectation for each service and operation
- However, from the System Log Parser report:
- Could identify service performance and see a statistical profile for each operation (by service)
- Decision support for maintenance and tuning opportunities
Summary
From the ArcGIS Enterprise log analysis, a report was generated that summarized the request and response activity of the Utility Network deployment.
The analysis and performance breakdown were from System Log Parser. System Log Parser is free tool for Windows and is also listed in the Well Architected Systems tools section.
The report provided statistical data to help answer questions about the Site such as:
- What was the most popular service
- Which methods were called by these services
- How the services were performing and whether the Site was well managed
- These could be answered
- When paired with performance goals of the organization
- From judgement based on experience
However, despite the analysis and task being completed...your work is not done!
The best Site analysis comes from periodically evaluating the deployment, because:
- Usage trends change over time
- Some services may become more popular, others less
- A potential opportunity to optimize dedicated service configurations
- You want to build up historical knowledge of the Site's performance behavior
- Understanding how functions perform from the services can help identify when behaviors and/or patterns look out-of-place or unusual
- This can assist with troubleshooting and tuning
- Can help highlight when the services and functions
- Are optimal
- Are not optimal
Running System Log Parser regularly (e.g., once a month) can help you build a historical understanding of your Site's performance. This Article focused on analyzing a Site with Utility Network services but the practice and strategies could be applied to any GIS deployment.

