ArcGIS Pro 3.1.1
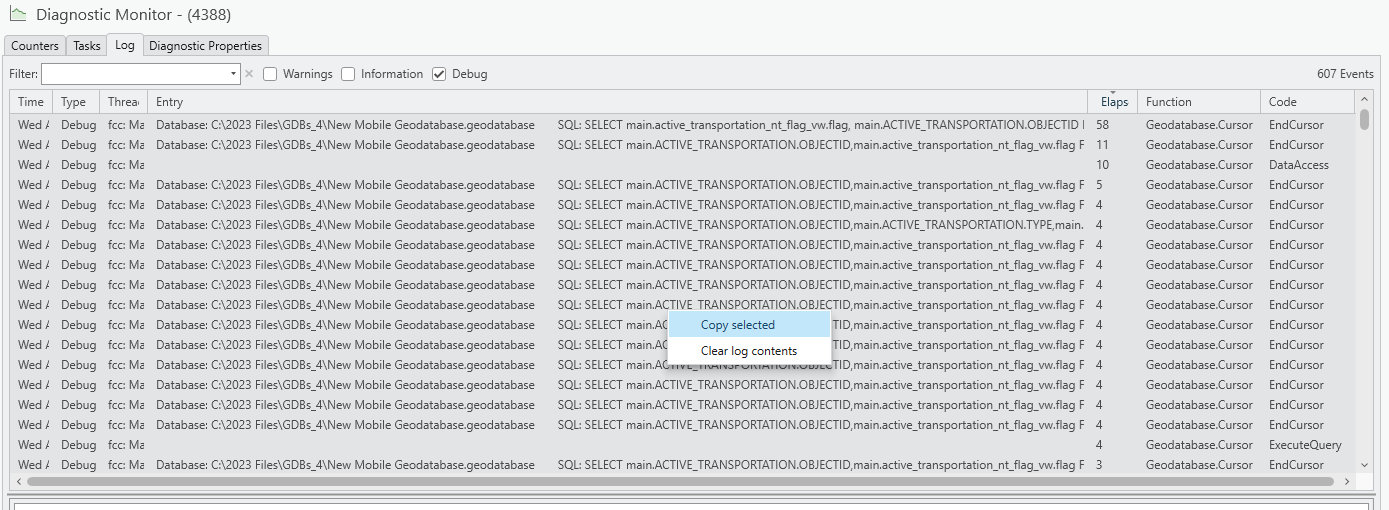
In the Diagnostic Monitor —> Log tab:
I can right-click the logs —> Copy selected:
When I paste the copied values into Excel, the data looks like this:
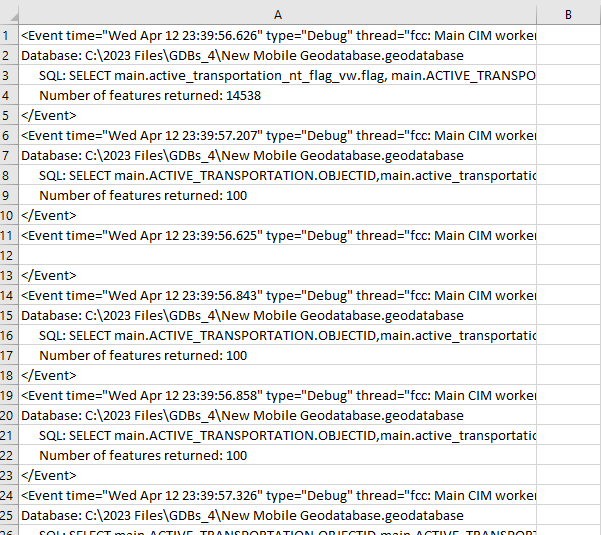
The log values are squished into a single column as <tags>.
It would be better if the data was formatted as a table, similar to how it looks in the Diagnostic Monitor Log tab:
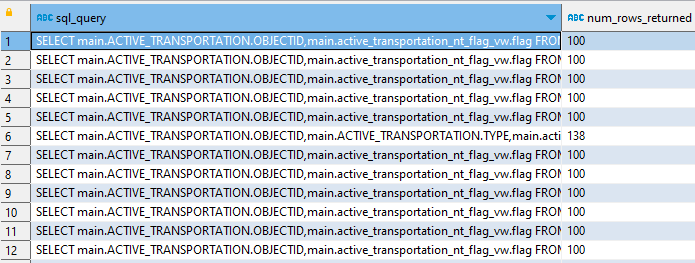
That would facilitate tabular analysis of the log data.
Could the Diagnostic Monitor logs be enhanced so that the data gets copied as a table, not as tags?