Hello,
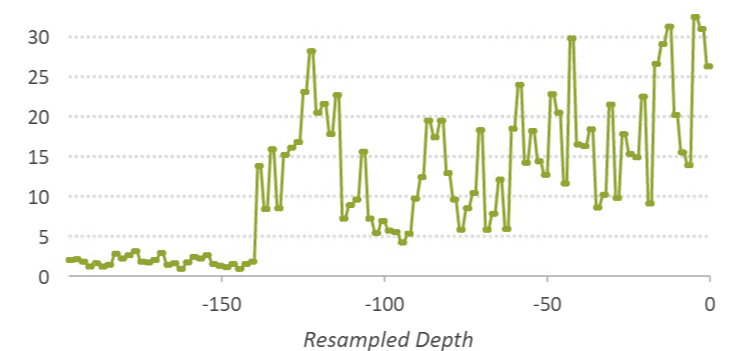
I am wondering if it's possible to customize the interval of numbers showing along x-axis. For example, for line chart below, the current interval is 50 and x-axis displays -150, -100, -50, 0. However, I want to customize the interval to 10, so the x-axis displays: -190, -180, -170, -160, -150, ......, -100, -90, ......, - 50, -40, ......, 0. Is this possible? Thank you.