Turn on suggestions
Auto-suggest helps you quickly narrow down your search results by suggesting possible matches as you type.
Cancel
- Home
- :
- All Communities
- :
- Products
- :
- Spatial Data Science
- :
- Spatial Data Science Questions
- :
- How to compare a TPI raster map (continuous variab...
Options
- Subscribe to RSS Feed
- Mark Topic as New
- Mark Topic as Read
- Float this Topic for Current User
- Bookmark
- Subscribe
- Mute
- Printer Friendly Page
How to compare a TPI raster map (continuous variable) with a land-use raster map (wetlands - categorical variable)?
Subscribe
416
0
11-27-2019 03:02 AM
11-27-2019
03:02 AM
- Mark as New
- Bookmark
- Subscribe
- Mute
- Subscribe to RSS Feed
- Permalink
- Report Inappropriate Content
I want to compare two maps (covering the same area):
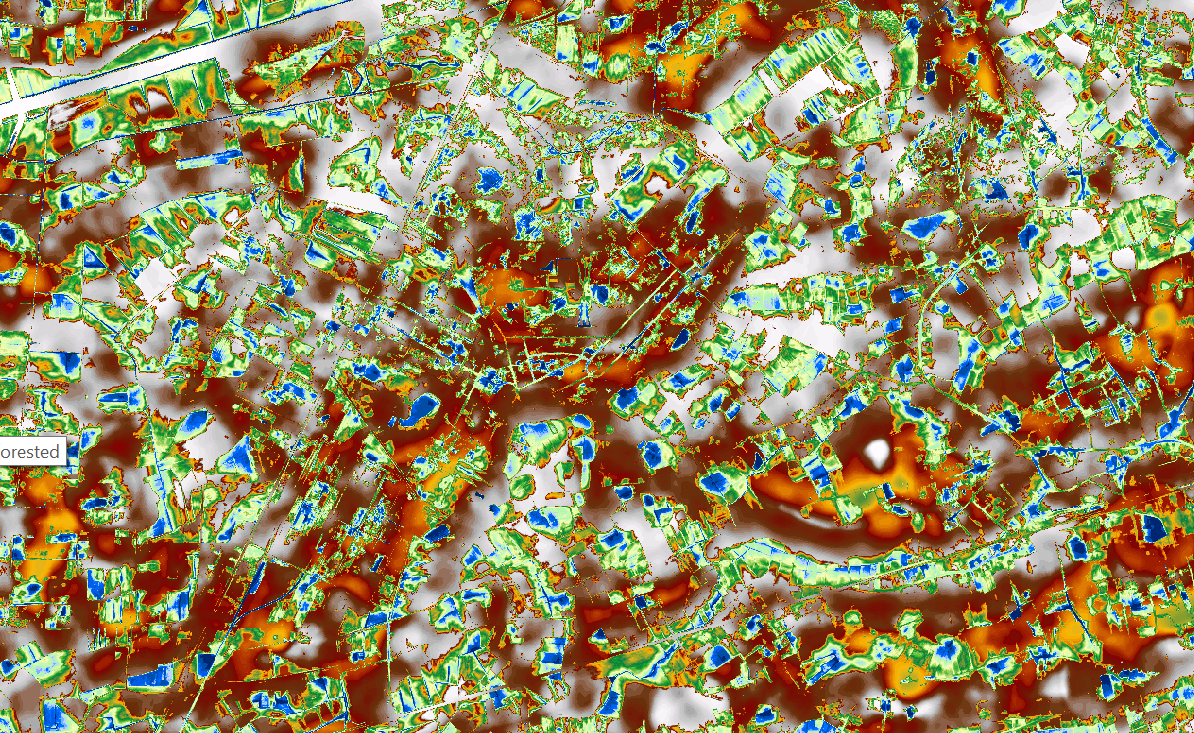
- a raster map of the Topographic Position Index (TPI) with values ranging from 0 to 100. This is a continuous variable. I added a picture in attachment.
- a raster map with wetlands (permanent wetland, temporal wetland, no wetlands present), so this is a categorical variable. I added a picture in attachment.
I want to check whether the TPI map can predict wetlands. I want to look for similar spatial patterns. Actually, we want to validate our TPI map by comparing it with this wetland map. We want to figure out whether our method for TPI is a good metric/indicator to map wetlands.
I was thinking in terms of probability (e.g. Bayesian Networks), but I am not sure this is the right technique.
Does someone know a technique I could use to analyse these two maps? I am using ArcGIS but other software programs (like R) can also be used of course.
0 Replies