- Home
- :
- All Communities
- :
- Products
- :
- ArcGIS Pro
- :
- ArcGIS Pro Questions
- :
- Bug: Number Formatting in Histogram Chart
- Subscribe to RSS Feed
- Mark Topic as New
- Mark Topic as Read
- Float this Topic for Current User
- Bookmark
- Subscribe
- Mute
- Printer Friendly Page
Bug: Number Formatting in Histogram Chart
- Mark as New
- Bookmark
- Subscribe
- Mute
- Subscribe to RSS Feed
- Permalink
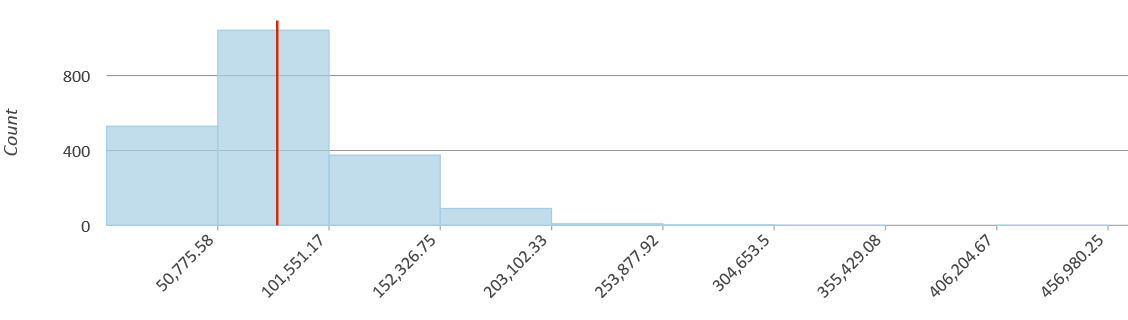
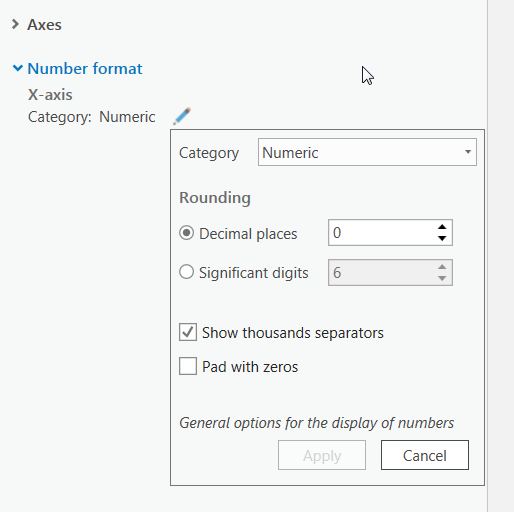
When I set the format of the value axis in the Properties dialog of a Histogram chart, I select 0 decimal places. ArcGIS Pro does not honor this preference, and instead presents the numbers on the chart with 2 decimal places.
- Mark as New
- Bookmark
- Subscribe
- Mute
- Subscribe to RSS Feed
- Permalink
So the X axis comes from the Category or Date parameter in the Chart Properties.
What data type is the field you're using there?
What are you portraying on the x-axis?
- Mark as New
- Bookmark
- Subscribe
- Mute
- Subscribe to RSS Feed
- Permalink
The histogram chart is showing a distribution of values within a dataset, where the X-axis represents the bins/break points of the distribution and Y-axis shows count of values within each bin.
- Mark as New
- Bookmark
- Subscribe
- Mute
- Subscribe to RSS Feed
- Permalink
Daniel.
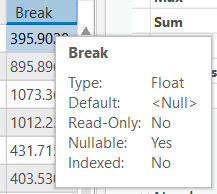
What data type is the field you're using there?
My Break field is a Float
2 decimals.

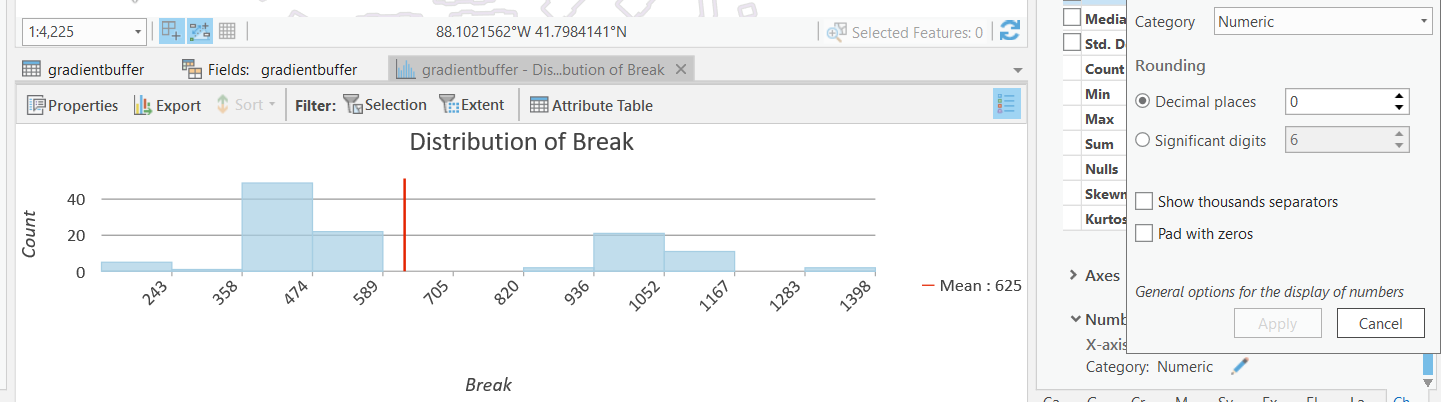
0 decimals
Would you be able to share the table you're working with? Do you see this behavior for all data, or only certain data?
- Mark as New
- Bookmark
- Subscribe
- Mute
- Subscribe to RSS Feed
- Permalink
apache_danielmatranga I tried again using a Double field and still cannot reproduce the same behavior that you're seeing. When I change the decimal places to 0, I get 0 decimal places.
But you're obviously seeing this issue, so we need to dig deeper.
Can you confirm that you're using ArcGIS Pro 2.1.2?
What is the source of your data (shapefile, file gdb, enterprise gdb (what RDBMS, version, etc.), other)?
Do you see the behavior with any data you work with or only with a certain table?
What is different about that table from other tables where you don't observe the behavior?
If you're able to share with me the data where this occurs, it would be important for us to look at it.
Thank you!
- Mark as New
- Bookmark
- Subscribe
- Mute
- Subscribe to RSS Feed
- Permalink
same issue. Pro is up to date. Happens all the time, regardless of data type. Seems almost random. Very frustrating. Could be connected to changing the font formats? (I've noticed another bug where exporting charts as graphics breaks after changing font formats or adding special characters...)
- Mark as New
- Bookmark
- Subscribe
- Mute
- Subscribe to RSS Feed
- Permalink
I have the same problem (more or less). I have several layers, that all have the same fields. In my scatter plot charts the numeric format for the x-axis (set as rate) is honoured in some cases, but not in all.
All layers have the same fields, same symbology etc and the same charts (I'm comparing different results of the same GP tool). I'm using ArcGIS Pro 3.0