- Home
- :
- All Communities
- :
- User Groups
- :
- Cartography and Maps
- :
- Questions
- :
- Issues viewing data in land use maps - help!
- Subscribe to RSS Feed
- Mark Topic as New
- Mark Topic as Read
- Float this Topic for Current User
- Bookmark
- Subscribe
- Mute
- Printer Friendly Page
- Mark as New
- Bookmark
- Subscribe
- Mute
- Subscribe to RSS Feed
- Permalink
Hi everyone. Hope I am posting in the right place. I am currently creating a set of land use maps and I am having an issue that I haven't experienced before. I am fairly competent but not amazing on ArcGIS and I've only been using the software for about a year. So I'm desperately hoping that this is an easy issue to fix and I've just missed something basic.
The issue: I am busy creating a set of land-use maps for the greater Johannesburg area in South Africa. I have three shapefiles. The years are 1990, 2000 and 2013. The major issue is that only some of the data is displaying on the 2013 file, despite all being in the attribute table.
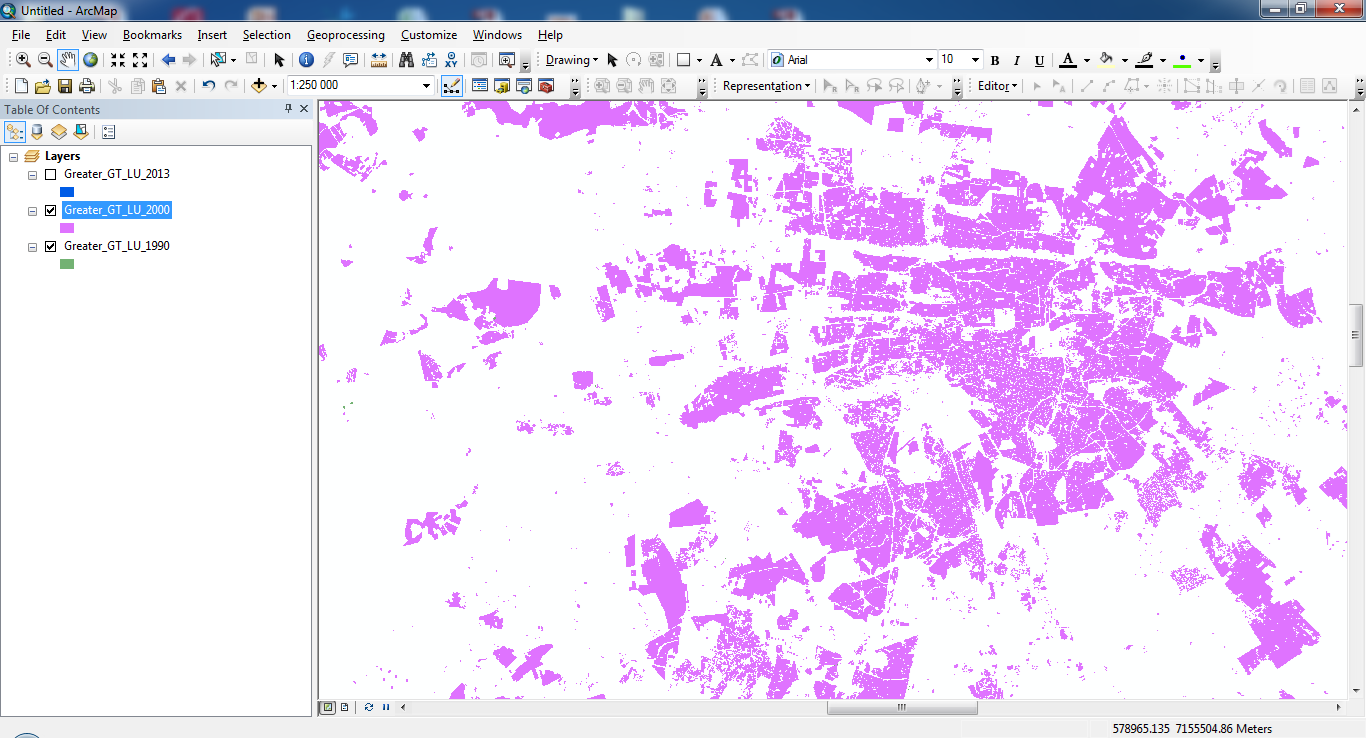
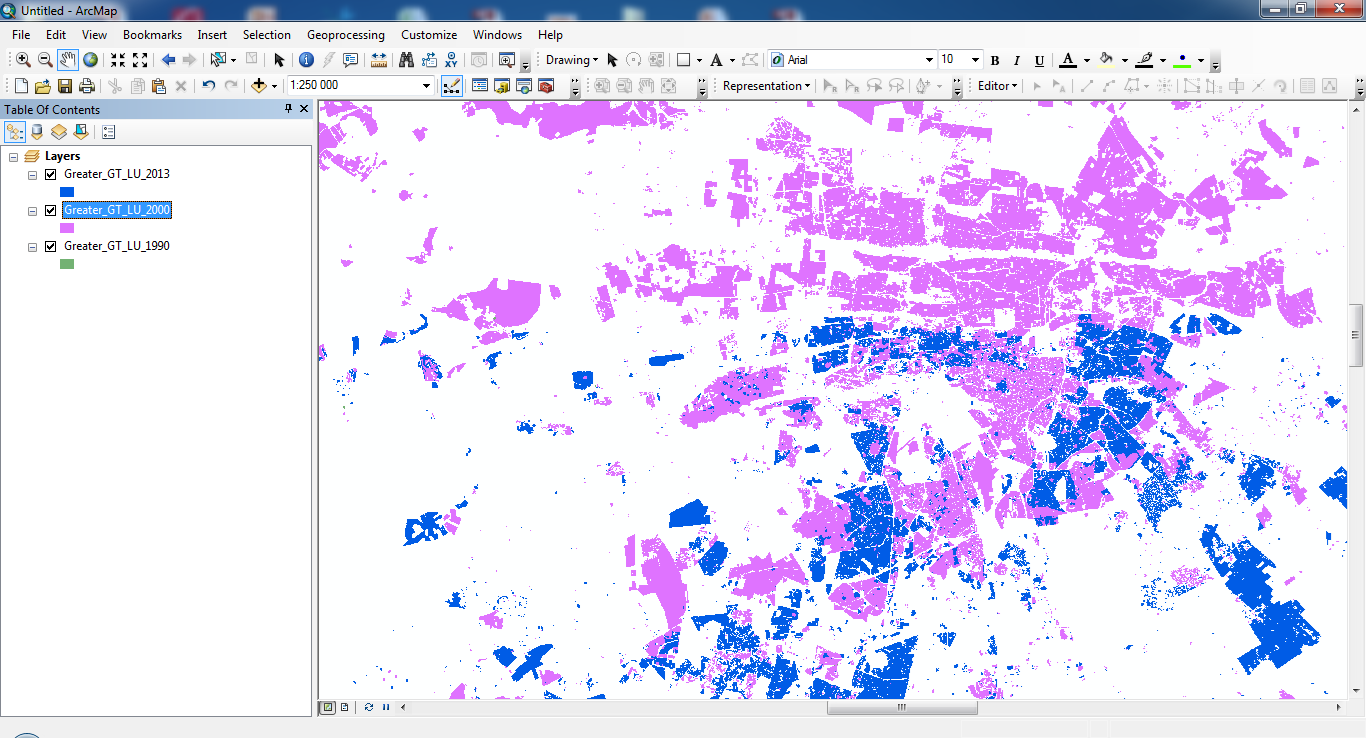
Hoping the images can give you a better idea. They are all taken on the same scale and site, with only the layers being turned on one by one.
If you look at the first image below, the green displays all the data available for 1990. In the next image, I have turned on the 2000 layer. As is expected, the pink covers all of the green, because we have more data in 2000. Then the issue comes when I turn on the 2013 layer. You'll see that there is still a lot of pink that is not covered by blue, which should not be the case, since all the 2000 areas have also been covered in 2013. If you look at the attribute tables, I am right. The 1990 attribute table has 44606 records; 2000 has 52258 records and 2013 has 56467 records.

Solved! Go to Solution.
Accepted Solutions
- Mark as New
- Bookmark
- Subscribe
- Mute
- Subscribe to RSS Feed
- Permalink
Sometimes shapefiles can start acting up due to data corruption where polygons will disappear as you zoom in or out. One thing that has worked for me to export the problem shapefile to a new shapefile and add that to back into the mxd. You'd have to determine whether any data was lost.
- Mark as New
- Bookmark
- Subscribe
- Mute
- Subscribe to RSS Feed
- Permalink
all in the same coordinate system I presume?
What happens when you toggle them off one at a time from the bottom up? ... ie reverse your 'toggle-on' process
What happens when you select one layer and right-click and 'Zoom to Layer'
Have you run a 'Check Geometry' from arctoolbox on the files to make sure they are all 'good' geometry wise?
just some initial thoughts. Never believe what you see, unless you can see what to believe in.
- Mark as New
- Bookmark
- Subscribe
- Mute
- Subscribe to RSS Feed
- Permalink
Thank you so much for the response, Dan.
All the layers are in the same coordinate system. So that's definitely not the issue.
Toggle on and off in different orders doesn't change anything.
Just ran a geometry check and there are no issues.
The 'zoom to layer' was more interesting. At that scale (1:2 182 186), I can only see a few small areas where the 2000 data shows through the 2013 data. The minute I zoom in, even very slightly, the 2013 data starts to disappear in no clear pattern. The layers are all set to show at all scales, and it's not that all the data isn't visible, but just bits of it. Any ideas?
- Mark as New
- Bookmark
- Subscribe
- Mute
- Subscribe to RSS Feed
- Permalink
something is amiss... I assumed that the data were added as separate layers from the same geodatabase.
The question becomes now... what is the source of the data? Something is controlling its visibility, so I would try:
- add the files separately to a new project in a separate dataframe/map (arcmap/Pro)... test that each layer is visible at all zoom levels. Do not mix the data until you can confirm that each layer/file behaves as it should.
- when they behave nicely on their own, try bringing two together and see how they behave together.. repeat with the pairs formed from the triple of data
Report on what happens
- Mark as New
- Bookmark
- Subscribe
- Mute
- Subscribe to RSS Feed
- Permalink
Sometimes shapefiles can start acting up due to data corruption where polygons will disappear as you zoom in or out. One thing that has worked for me to export the problem shapefile to a new shapefile and add that to back into the mxd. You'd have to determine whether any data was lost.
- Mark as New
- Bookmark
- Subscribe
- Mute
- Subscribe to RSS Feed
- Permalink
Ken and Dan, thank you so much for your help! You were absolutely right, it was a visibility issue. Exported it to a new shapefile and it is working perfectly.
I have another quick question, which I assume you'll be able to answer (if not, I'll create a new thread): Is there a tool that can generate a comparison between data sets? Basically, for each of the three years, I've got a dataset that includes an ID number (common across the three datasets) and a land use. I'd like to be able to isolate the areas where there has been a change. ie. in 2000 this piece of land was industrial; now it's residential. And then map the change. Hope that makes sense.
Thanks again for the help!
- Mark as New
- Bookmark
- Subscribe
- Mute
- Subscribe to RSS Feed
- Permalink
Since this is a different subject, you should start a new discussion.
In the meantime, you should mark the post that best answered your question to help others with this same problem.