- Home
- :
- All Communities
- :
- Developers
- :
- Python
- :
- Python Questions
- :
- Why does Arcpy produce different results than rast...
- Subscribe to RSS Feed
- Mark Topic as New
- Mark Topic as Read
- Float this Topic for Current User
- Bookmark
- Subscribe
- Mute
- Printer Friendly Page
Why does Arcpy produce different results than raster calculator/map algebra?
- Mark as New
- Bookmark
- Subscribe
- Mute
- Subscribe to RSS Feed
- Permalink
I need to do binary thresholding on several rasters of the Color Index of Vegetation Extraction (CIVE). First, I calculate the index in Arcpy, then I load each up raster individually in ArcMap to run binary thresholding from the Image Analysis Window. Unfortunately, I get an entirely black image.
So, I then selected one date and calculated the CIVE manually in the Raster Calculator (this takes a long time since each of the bands in the CIVE formula need to be modified before calculating the index). The binary thresholding image from this raster is perfect. Vegetation (maize) pixels are clearly identified.
As far as I can tell, the CIVE from ArcPy and the CIVE from ArcMap are identical (see attached images). I cannot figure out what is going on here, and really can't afford the time to do all this manually because I have the same problem with the Excess Red Index (ExG) and the Excess Green Minus Excess Red Index (ExGR). Oddly, I DON'T have this problem with the Excess Green Index even though it is run in the same script...
Here is a code snippet for the CIVE calculation. Note that red=Band_1, Green=Band_2, and Blue=Band_6 because I merged the orthomosaics from two filter-modified digital cameras.
print "Calculating and saving CIVE..."
for raster in rasters:
    red = Float(Raster(raster+"/Band_1"))/(Raster(raster+"/Band_1")+Raster(raster+"/Band_2")+Raster(raster+"/Band_6"))
    green = Float(Raster(raster+"/Band_2"))/(Raster(raster+"/Band_1")+Raster(raster+"/Band_2")+Raster(raster+"/Band_6"))
    blue = Float(Raster(raster+"/Band_6"))/(Raster(raster+"/Band_1")+Raster(raster+"/Band_2")+Raster(raster+"/Band_6"))
    outcive = Float((0.441*red)-(0.881*green)+(0.385*blue)+18.78745)
    outcive.save(CIVEFolder+"//"+"CIVE_"+raster[-6:-4]+".tif")
    print outcive
print "Done..."
Binary thresholding of CIVE from ArcMap
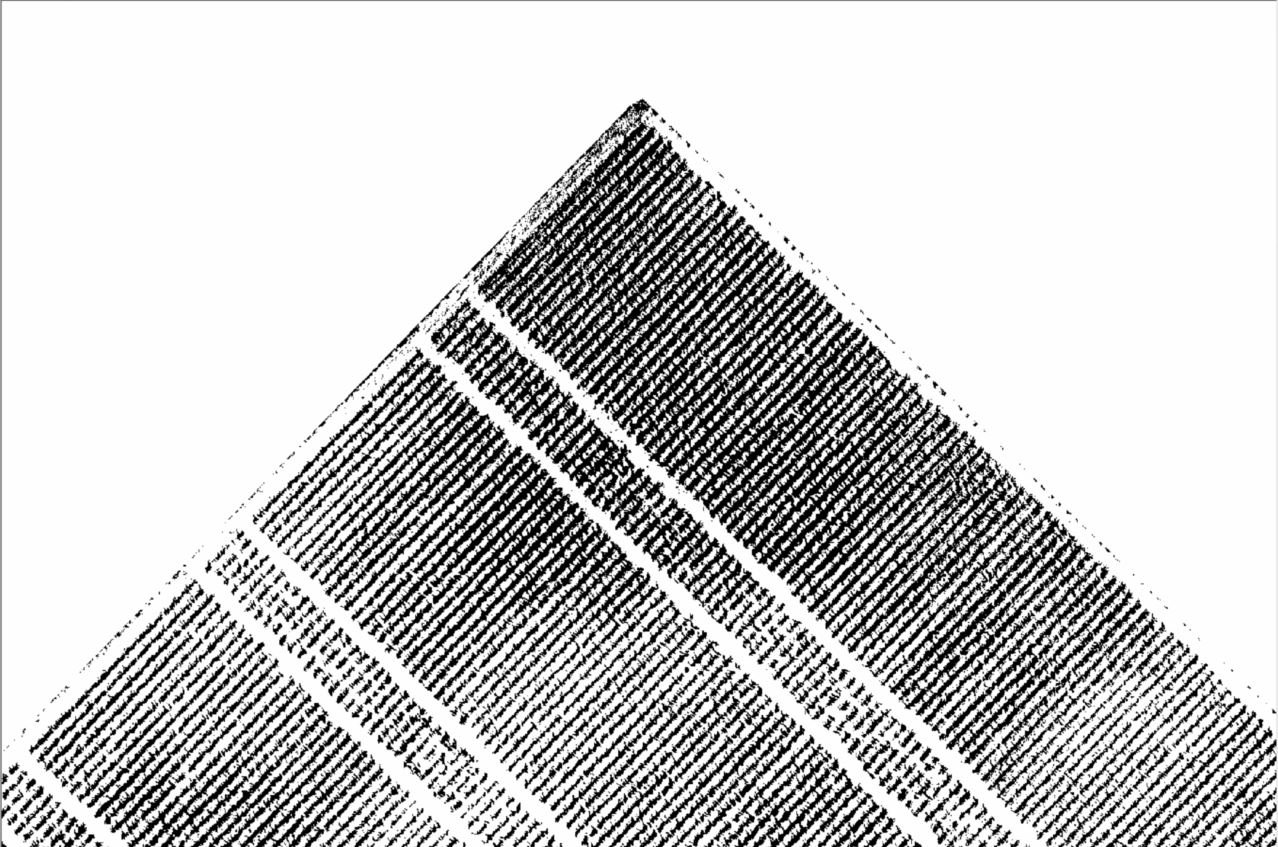
Binary thresholding of CIVE from ArcPy

Example pixel showing that ArcMap and ArcPy CIVEs are identical
![]()
Solved! Go to Solution.
Accepted Solutions
- Mark as New
- Bookmark
- Subscribe
- Mute
- Subscribe to RSS Feed
- Permalink
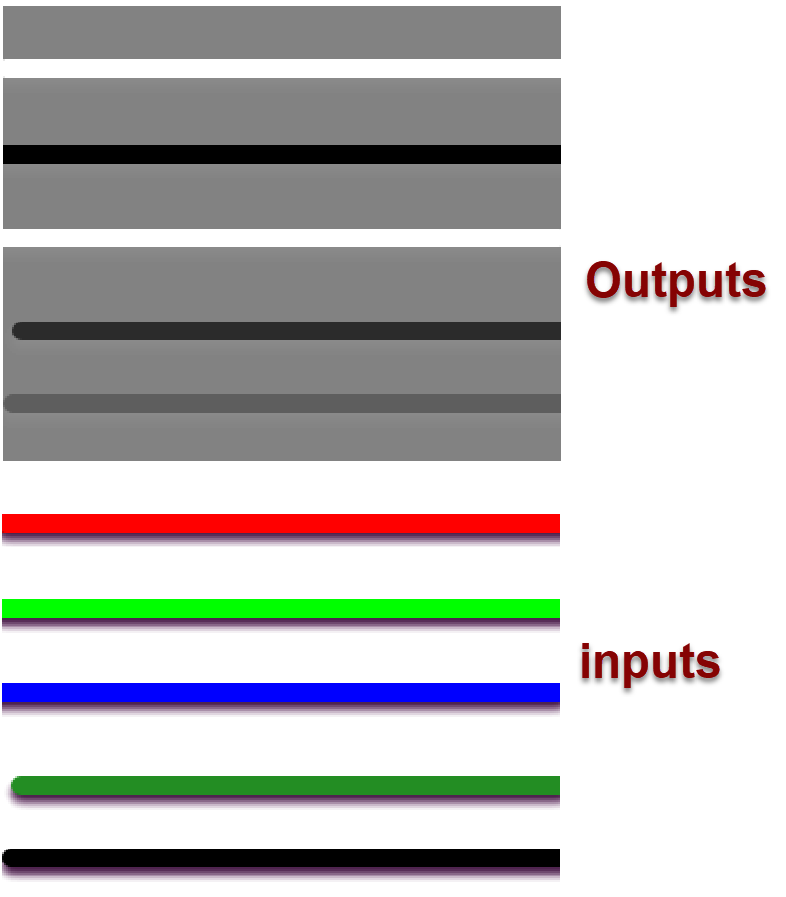
Numpy done, png in... tif out, The middle line is green in the lower figure believe it or not
def num_109():
"""raster band math... just a quick demo
: note: Bands are number from 0 to n,
: references
: http://conteudo.icmc.usp.br/pessoas/moacir/papers/Ponti_GRSL2013.pdf
: http://www.sciencedirect.com/science/article/pii/S2214317315000347
:
:a = np.zeros(shape=(5, 5, 6), dtype='int32')
a[..., 0] = vals[0] # 1
a[..., 1] = vals[1] # 2
a[..., 5] = vals[2] # 6
"""
import arcpy
f = r'C:\Book_Materials\images\rgb.png' # an image
arcpy.overwriteOutput = True
bands = arcpy.RasterToNumPyArray(f)
a = bands[:3, :]
r = bands[0, :]
g = bands[1, :]
b = bands[2, :]
k = bands[3, :]
# normalize
denom = (r + g + b)
denom = denom.astype('float')
r1 = r/(denom)
g1 = g/(denom)
b1 = b/(denom)
args = [r, g, b]
print("Band 1\n{}\nBand 2\n{}\nBand 6\n{}".format(*args))
cive = (0.441 * r) - (0.881 * g) + (0.385 * b) + 18.78745
cive_2 = np.zeros(cive.shape, dtype='int32')
cive_2 = np.zeros(cive.shape, dtype='int32')
#exg = 2*g1 - r1 - b1
print("CIVE result...\n{}\n ExG result...\n{}".format(cive, cive_2))
out = arcpy.NumPyArrayToRaster(cive_2)
out.save(f.replace('.png', '1.tif'))
return a, r, g, b, k
# __main__ .... code section
if __name__ == "__main__":
a, r, g, b, k = num_109() # raster band math demo- Mark as New
- Bookmark
- Subscribe
- Mute
- Subscribe to RSS Feed
- Permalink
could be a symbology issue, what is the nodata value for both and how do their symbologies compare? Also check the raster type (since the bit type may have been promoted in one)
- Mark as New
- Bookmark
- Subscribe
- Mute
- Subscribe to RSS Feed
- Permalink
Thanks for the advice, Dan. I think you are right about the bit-depth because the NoData values and symbologies are identical. The Excess Green Index I produced is 32-bit floating point, whereas the CIVE and all other indices are 64-bit double-precision.
Could it be possible that the decimal coefficients in the CIVE index are messing up the bit-depth? If so, how could I fix the outputs to be 32-bit floating point? Some formulas are below for comparison.
CIVE = 0.441r - 0.881g +0.385b +18.78745
ExG = 2g-r-b
ExR = 1.4r-b
ExGR = Exg-ExR
- Mark as New
- Bookmark
- Subscribe
- Mute
- Subscribe to RSS Feed
- Permalink
I suspect you are going to have to deal with the Nodata (Environment Settings) in your script and 'Map Down' I think, but it has been some time since I normally work with numpy arrays where you have direct explicit control over the data type.
- Mark as New
- Bookmark
- Subscribe
- Mute
- Subscribe to RSS Feed
- Permalink
This didn't work, unfortunately. Numpy would be better but am not sure how I would go about it. Here's what I am thinking:
# assume that I already set up a list called composites, which are 6-band GeoTiffs for which I need to use bands 1,2, and 6
# Also assume that I have lists for all the relevant geotransform properties in order to convert output back to raster
#N ot sure what to set NoData to in RasterToNumpyArray
nparrays = []
for i, raster in enumerate(composites):
    nparrays.append(arcpy.RasterToNumPyArray(raster, nodata_to_value=raster.noDataValue).astype(float))
# Apply the CIVE formula of 0.441r - 0.881g +0.385b +18.78745
CIVE_arrays = []
for date, numpyarrays in enumerate(nparrays):
    CIVE = np.zeros_like (numpyarrays, np.float32)
    # **not sure how to actually run the formula from here** because I don't know how to select dimensions 0,1, and 5
    for i in range (0,5) #
        CIVE[i,:,:] = 0.441*[i=0]-0.881[i=2]+0.385[i=6]+18.78745   # obviously the i= are invalid syntax
- Mark as New
- Bookmark
- Subscribe
- Mute
- Subscribe to RSS Feed
- Permalink
An example... I used an array with a shape of (5, 5, 6)... 5 rows, 5 columns and 6 bands... This can just as easily be done using reshaped array with the bands first, then rows and cols (ie (6, 5, 5)
a = np.zeros(shape=(5,5,6), dtype='float32')
a[..., 0] = 1
a[..., 1] = 2
a[..., 5] = 6
r = a[..., 0] # = 1 from 'a' definition
g = a[..., 1]
b = a[..., 5]
args = [r, g, b]
print("Band 1\n{}\nBand 2\n{}\nBand 6\n{}".format(*args))
result = 0.441*r - 0.881*g +0.385*b + 18.78745
print("Result...\n{}".format(result))which would look like this as results
Band 1
[[ 1.0 1.0 1.0 1.0 1.0]
[ 1.0 1.0 1.0 1.0 1.0]
[ 1.0 1.0 1.0 1.0 1.0]
[ 1.0 1.0 1.0 1.0 1.0]
[ 1.0 1.0 1.0 1.0 1.0]]
Band 2
[[ 2.0 2.0 2.0 2.0 2.0]
[ 2.0 2.0 2.0 2.0 2.0]
[ 2.0 2.0 2.0 2.0 2.0]
[ 2.0 2.0 2.0 2.0 2.0]
[ 2.0 2.0 2.0 2.0 2.0]]
Band 6
[[ 6.0 6.0 6.0 6.0 6.0]
[ 6.0 6.0 6.0 6.0 6.0]
[ 6.0 6.0 6.0 6.0 6.0]
[ 6.0 6.0 6.0 6.0 6.0]
[ 6.0 6.0 6.0 6.0 6.0]]
Result...
[[ 19.8 19.8 19.8 19.8 19.8]
[ 19.8 19.8 19.8 19.8 19.8]
[ 19.8 19.8 19.8 19.8 19.8]
[ 19.8 19.8 19.8 19.8 19.8]
[ 19.8 19.8 19.8 19.8 19.8]]
- Mark as New
- Bookmark
- Subscribe
- Mute
- Subscribe to RSS Feed
- Permalink
I made a mistake in the formula and forgot to carry over the normalization (e.g. r/r+g+b) from my original spatial analyst script. Altering your example with the division yields a divide by zero error:
numpyarrays = arcpy.RasterToNumPyArray(infile, nodata_to_value=infile.noDataValue).astype(float)
# Apply the CIVE formula of 0.441r - 0.881g +0.385b +18.78745
r = numpyarrays[0,:,:]
g = numpyarrays[1,:,:]
b = numpyarrays[5,:,:]
args = [r, g, b]
print("Band 1\n{}\nBand 2\n{}\nBand 6\n{}".format(*args))
CIVE = 0.441*(r/r+g+b) - 0.881*(g/r+g+b) +0.385*(b/r+g+b) + 18.78745
print("Result...\n{}".format(CIVE))
#----------------------------------------------------------------------------------------------------------------------------------
C:/Users/Default.Default-PC/.PyCharmEdu3.5/config/scratches/scratch_5.py:48: RuntimeWarning: invalid value encountered in divide
CIVE = 0.441*(r/r+g+b) - 0.881*(g/r+g+b) +0.385*(b/r+g+b) + 18.78745
C:/Users/Default.Default-PC/.PyCharmEdu3.5/config/scratches/scratch_5.py:48: RuntimeWarning: divide by zero encountered in divide
CIVE = 0.441*(r/r+g+b) - 0.881*(g/r+g+b) +0.385*(b/r+g+b) + 18.78745
- Mark as New
- Bookmark
- Subscribe
- Mute
- Subscribe to RSS Feed
- Permalink
Also, the NoData value is -1.797693e+308.
I also found this discussion from 2015 which you were also involved in. This is almost certainly my problem, but the OP never updated with a solution.
- Mark as New
- Bookmark
- Subscribe
- Mute
- Subscribe to RSS Feed
- Permalink
deja vu.... copyraster or numpy... who would have thought ... memory is slipping ... enjoy the example
EDIT
I should add if you want to change the dtype back to something before saving, then you can do the conversion by making an array of the desired dtype and shape and copying the values over into it. Here is an example using the cive changing out to an int32 array rather than the float64 array you would get
cive_2 = np.zeros(cive.shape, dtype='int32')
cive_2[:] = cive
cive result...
[[ 19.4 19.4 19.4 19.4 19.4]
[ 19.4 19.4 19.4 19.4 19.4]
[ 19.4 19.4 19.4 19.4 19.4]
[ 19.4 19.4 19.4 19.4 19.4]
[ 19.4 19.4 19.4 19.4 19.4]]
cive_2 result...
[[19 19 19 19 19]
[19 19 19 19 19]
[19 19 19 19 19]
[19 19 19 19 19]
[19 19 19 19 19]]
cive.dtype, cive_2.dtype
(dtype('float64'), dtype('int32'))- Mark as New
- Bookmark
- Subscribe
- Mute
- Subscribe to RSS Feed
- Permalink
Numpy done, png in... tif out, The middle line is green in the lower figure believe it or not
def num_109():
"""raster band math... just a quick demo
: note: Bands are number from 0 to n,
: references
: http://conteudo.icmc.usp.br/pessoas/moacir/papers/Ponti_GRSL2013.pdf
: http://www.sciencedirect.com/science/article/pii/S2214317315000347
:
:a = np.zeros(shape=(5, 5, 6), dtype='int32')
a[..., 0] = vals[0] # 1
a[..., 1] = vals[1] # 2
a[..., 5] = vals[2] # 6
"""
import arcpy
f = r'C:\Book_Materials\images\rgb.png' # an image
arcpy.overwriteOutput = True
bands = arcpy.RasterToNumPyArray(f)
a = bands[:3, :]
r = bands[0, :]
g = bands[1, :]
b = bands[2, :]
k = bands[3, :]
# normalize
denom = (r + g + b)
denom = denom.astype('float')
r1 = r/(denom)
g1 = g/(denom)
b1 = b/(denom)
args = [r, g, b]
print("Band 1\n{}\nBand 2\n{}\nBand 6\n{}".format(*args))
cive = (0.441 * r) - (0.881 * g) + (0.385 * b) + 18.78745
cive_2 = np.zeros(cive.shape, dtype='int32')
cive_2 = np.zeros(cive.shape, dtype='int32')
#exg = 2*g1 - r1 - b1
print("CIVE result...\n{}\n ExG result...\n{}".format(cive, cive_2))
out = arcpy.NumPyArrayToRaster(cive_2)
out.save(f.replace('.png', '1.tif'))
return a, r, g, b, k
# __main__ .... code section
if __name__ == "__main__":
a, r, g, b, k = num_109() # raster band math demo