- Home
- :
- All Communities
- :
- Products
- :
- ArcGIS CityEngine
- :
- ArcGIS CityEngine Questions
- :
- Parameterized Rule
- Subscribe to RSS Feed
- Mark Topic as New
- Mark Topic as Read
- Float this Topic for Current User
- Bookmark
- Subscribe
- Mute
- Printer Friendly Page
Parameterized Rule
- Mark as New
- Bookmark
- Subscribe
- Mute
- Subscribe to RSS Feed
- Permalink
Hello
I'm trying to figure out how big a percent an area of a surface is compared to the area of multiple surfaces.
Hope somebody has any idea of how this can be achieved, basically, I want to know how big a percent each of the A3 is compared to the sum of all the A3's. This is the code I have been writing.
attr rotateLot = 0
attr b1 = 40
attr r1 = 10
attr s1 = 40
attr r2 = 20
attr a0Dist =50
attr dist01 = 10lot -->
alignScopeToGeometry(yUp, 1)
rotateScope (0,rotateLot,0)
split(x) { b1 : A01 | r1 : B01 | ~1 : A01 | r2: C01 | s1 : D01}A01 -->
split(z) {a0Dist : A02 | a0Dist : A02 | ~1 : Grass}A02 -->
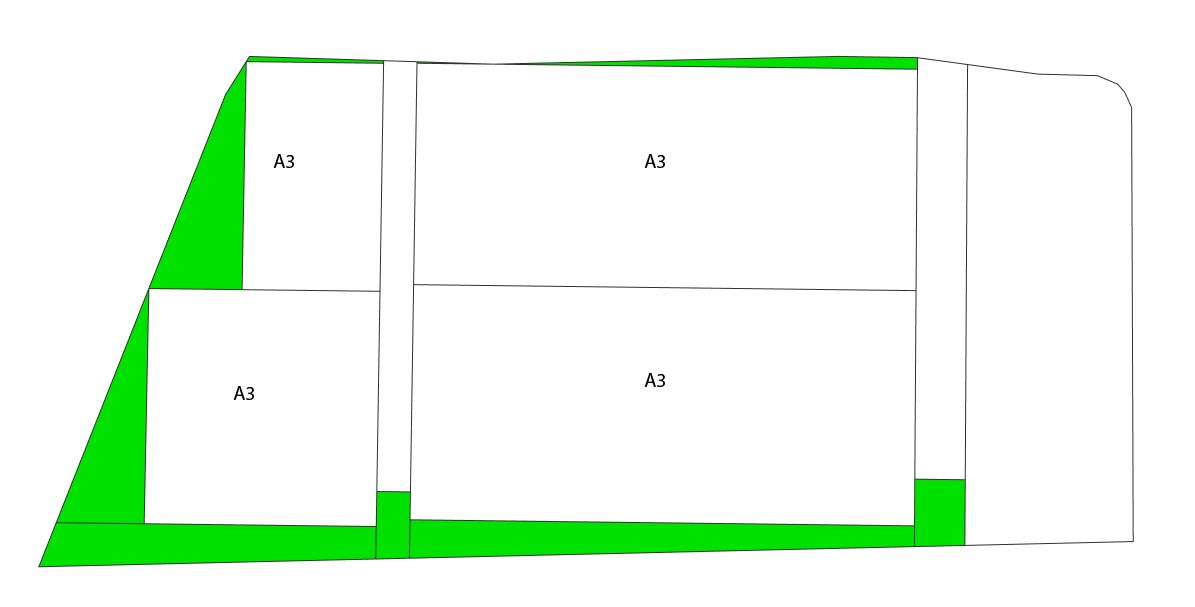
innerRectangle(edge) {shape : A03(geometry.area) | remainder = Grass}A03(area)-->
print(area)
when running the script the console prints the area for the four A03 shapes, is there any way to get the sum of that "list"? If I find the sum the goal is to take the sum and then divide that by the area of each individual shape in order to figure out how large a percent each shape is compared to the whole.
I hope somebody knows how this can be done, or at least an idea of where to look.
- Mark as New
- Bookmark
- Subscribe
- Mute
- Subscribe to RSS Feed
- Permalink
With reports, you can report the area of each A3 plot, and you can also retrieve the sum of these areas. Then, in the dashboard, you can create a chart that divides each A3 plot area by the sum to get the percentage area for each A3 plot.
In the rule above, you don't need to pass geometry.area to the A03 rule because you can just call it in the A03 rule. Then, you can report this area. Then, all reports will be summed, and you can see the SUM (along with the count, min, max, avg) for the report called "AreaA3" in the Reports section in the Inspector. This will be the sum coming from all objects that are selected.
report("AreaA3", geometry.area)You can also create a dashboard which will display the sum for all objects in the scene (whether they are selected or not). Window -> Show Dashboard -> Add a Chart -> Select the report -> Key number -> Report = AreaA3.
Or, you can use sub-reports to create a column for each A3 plot in a bar chart. The suffix after the period is the sub-report name. Then, select the parent report (name before the period) to create a bar chart in the dashboard. To create names for the sub-reports, you could use the indices from the splits to create a unique name for each A3 plot.
lot -->
alignScopeToGeometry(yUp, 1)
rotateScope (0,rotateLot,0)
split(x) { b1 : A01(split.index) | r1 : B01 | ~1 : A01(split.index) | r2: C01 | s1 : D01}
A01(ind1) -->
split(z) {a0Dist : A02(ind1, split.index) | a0Dist : A02(ind1, split.index) | ~1 : Grass}
A02(ind1, ind2) -->
innerRectangle(edge) {shape : A03(ind1, ind2) | remainder = Grass}
A03(ind1, ind2)-->
print(area)
report("AreaA3." + ind1 + "_" + ind2, geometry.area)
In the Dashboard, you could create a bar/pie/stack chart with Report = AreaA3.* and Divide By = AreaA3. Then each bar/section in the chart will represent an A3 plot and will show its percentage area.
Here is a tutorial on reporting:
Tutorial 11: Reporting—CityEngine Tutorials | ArcGIS Desktop