- Home
- :
- All Communities
- :
- User Groups
- :
- Coordinate Reference Systems
- :
- Questions
- :
- How do i expand data display range in a map in Arc...
- Subscribe to RSS Feed
- Mark Topic as New
- Mark Topic as Read
- Float this Topic for Current User
- Bookmark
- Subscribe
- Mute
- Printer Friendly Page
How do i expand data display range in a map in ArcGIS
- Mark as New
- Bookmark
- Subscribe
- Mute
- Subscribe to RSS Feed
- Permalink
Hello All, I am working on interpolating rainfall erosivity data in ArcMap 10.1 using the Goestatistical interpolation tool. I have data covering 6 sites. What i am getting however using IDW, or local polynomial interpolation (PLI) or even Radial Basis function (RBF) does not fit in with the range of values used in the interpolation. And this is still the case when i changed the environment in the geostastical analysis to max from the default mean. For instance while the maximum number from the table is 3100+, using any of the interpolation tools, even with max values gives a maximum of say 2,100 inn the map. My questions is how do i correct this anomaly to make sure the map display covers the range in the table. This is critical, otherwise the values in the map will not be a true reflection of the situation according to the data used in producing the table. I have tried using the mean, all and mini values and none seems to make much sense.
- Mark as New
- Bookmark
- Subscribe
- Mute
- Subscribe to RSS Feed
- Permalink
a map of the input locations and their number would be useful, since few observations, poorly laid out will almost always ensure poor results regardless of the interpolator. Many references could be suggested, but why have you honed in on one particular set and why interpolation, rather than spatial allocation?
So a map would help with the extents shown.
- Mark as New
- Bookmark
- Subscribe
- Mute
- Subscribe to RSS Feed
- Permalink
ps you are posting in the wrong space. You should move it to Spatial Analyst using the move option since the people that frequent this space may be wondering what the post has to do with the focus of the place
- Mark as New
- Bookmark
- Subscribe
- Mute
- Subscribe to RSS Feed
- Permalink
@Dan, i have tried Local polynomial Interpolation (LPI) using the maximum in the environment setting and it looks like that will better than the others. Attached are two maps showing the spatial distribution of the locations (right) and what i got using the LPI (left). The data period ranges between 42 yrs to 14 yrs for the 6 stations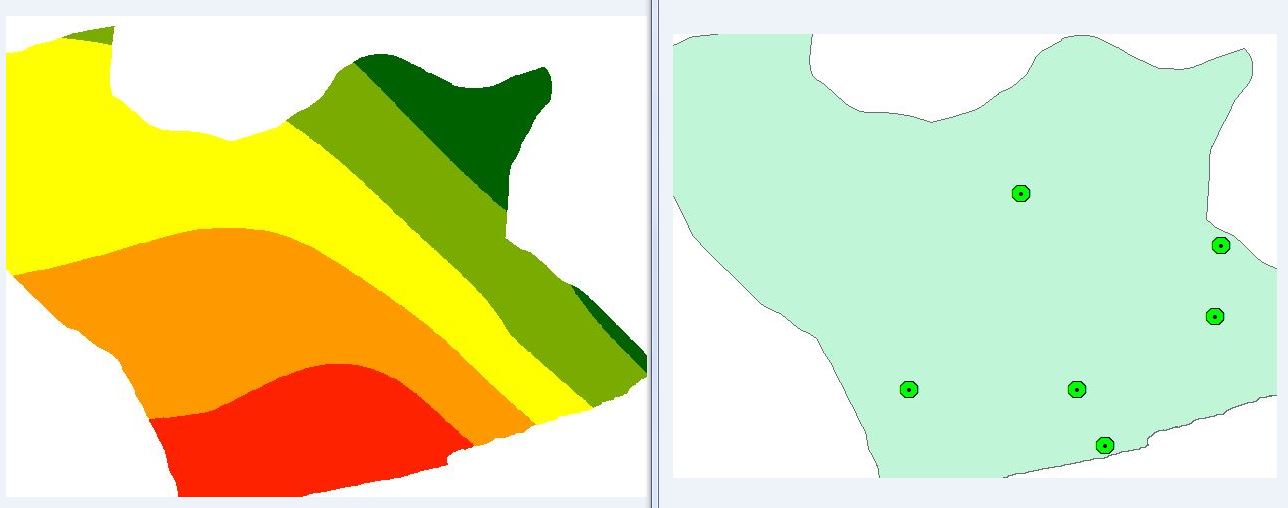
- Mark as New
- Bookmark
- Subscribe
- Mute
- Subscribe to RSS Feed
- Permalink
Dan Patterson, I chose the Local polynomial interpolation because its takes into consideration local conditions in terms of topography and other irregularities as compared with IDW which relies on weighted distance.
- Mark as New
- Bookmark
- Subscribe
- Mute
- Subscribe to RSS Feed
- Permalink
You are extrapolating way outside of the bounds of your data points... anything can happen...
I wouldn't even suggest that the results that far from the data are even meaningful...
sorry, but I mentioned this in one of your other threads.
You have chosen to cover the study area and not the area that the data cover.
They are two different things.
- Mark as New
- Bookmark
- Subscribe
- Mute
- Subscribe to RSS Feed
- Permalink
Dan Patterson, as it is this is all i have so what are my alternatives?, as i stated sometime although precision is critical to the success of the research there are real limitations such as on-site data availability in a data poor country, so what i have to figure out is how to make the best of a bad situation. I am trying to assess some data sources like climate data from NASA power which has data in openGRADS format, not yet sure what i can get from there. Any suggestions?
- Mark as New
- Bookmark
- Subscribe
- Mute
- Subscribe to RSS Feed
- Permalink
You show what you have in an area that you have data for.
You can make suggestions that other areas will behave in a similar pattern if indeed they will (ie similar terrains, climatic conditions etc).
In my opinion, extrapolating into the unknown is not doing your case any justice. I will give you credit, you have left the data points on the map....the vast majority don't
- Mark as New
- Bookmark
- Subscribe
- Mute
- Subscribe to RSS Feed
- Permalink
ps... you still haven't moved the thread to an appropriate location... coordinate ref system is not the place to get help on this type of topic