- Home
- :
- All Communities
- :
- Products
- :
- ArcGIS Spatial Analyst
- :
- ArcGIS Spatial Analyst Questions
- :
- IDW - is this an interpolation error?
- Subscribe to RSS Feed
- Mark Topic as New
- Mark Topic as Read
- Float this Topic for Current User
- Bookmark
- Subscribe
- Mute
- Printer Friendly Page
IDW - is this an interpolation error?
- Mark as New
- Bookmark
- Subscribe
- Mute
- Subscribe to RSS Feed
- Permalink
- Report Inappropriate Content
Hi there,
We have produced an interpolated map using the IDW tool from the Spatial Analyst extension, with a cell size of 1,000 meters and a fixed distance of 4,000 meters. Other parameters are defaulted. The attached illustration shows a detail of what seems like an abnormal result: Sample sites are indicated with the red circles with their value in bold italic face. The IDW cell values are indicated in the cell center. Could anyone explain why is there a cell with a value of 353 in that cell by the center of the figure, when there are no high values in the vicinity. What is the source of this artifact? Thanks for your help.

- Mark as New
- Bookmark
- Subscribe
- Mute
- Subscribe to RSS Feed
- Permalink
- Report Inappropriate Content
That seems pretty odd to have that one outlier in the middle like that. Have you done any other testing on this to see if this sort of issue persists? Have you tried other interpolation methods to see if you get similar values? I also wonder if you were to try the same IDW with the same criteria if you would get the same results.
- Mark as New
- Bookmark
- Subscribe
- Mute
- Subscribe to RSS Feed
- Permalink
- Report Inappropriate Content
Thanks Adrian for your prompt answer. I tried with IDW variable distance, krigging, and natural neighbor from the SA, and IDW standard circular with a radius of 4000 from the Geostatistical Analyst, always keeping the same cell size (1,000 m) and these methods do not show that behavior. It seems to be happening only with IDW fixed distance. It also happens at some boundary cells, where there are no more data points, as in the illustration included. Is that weird or explainable?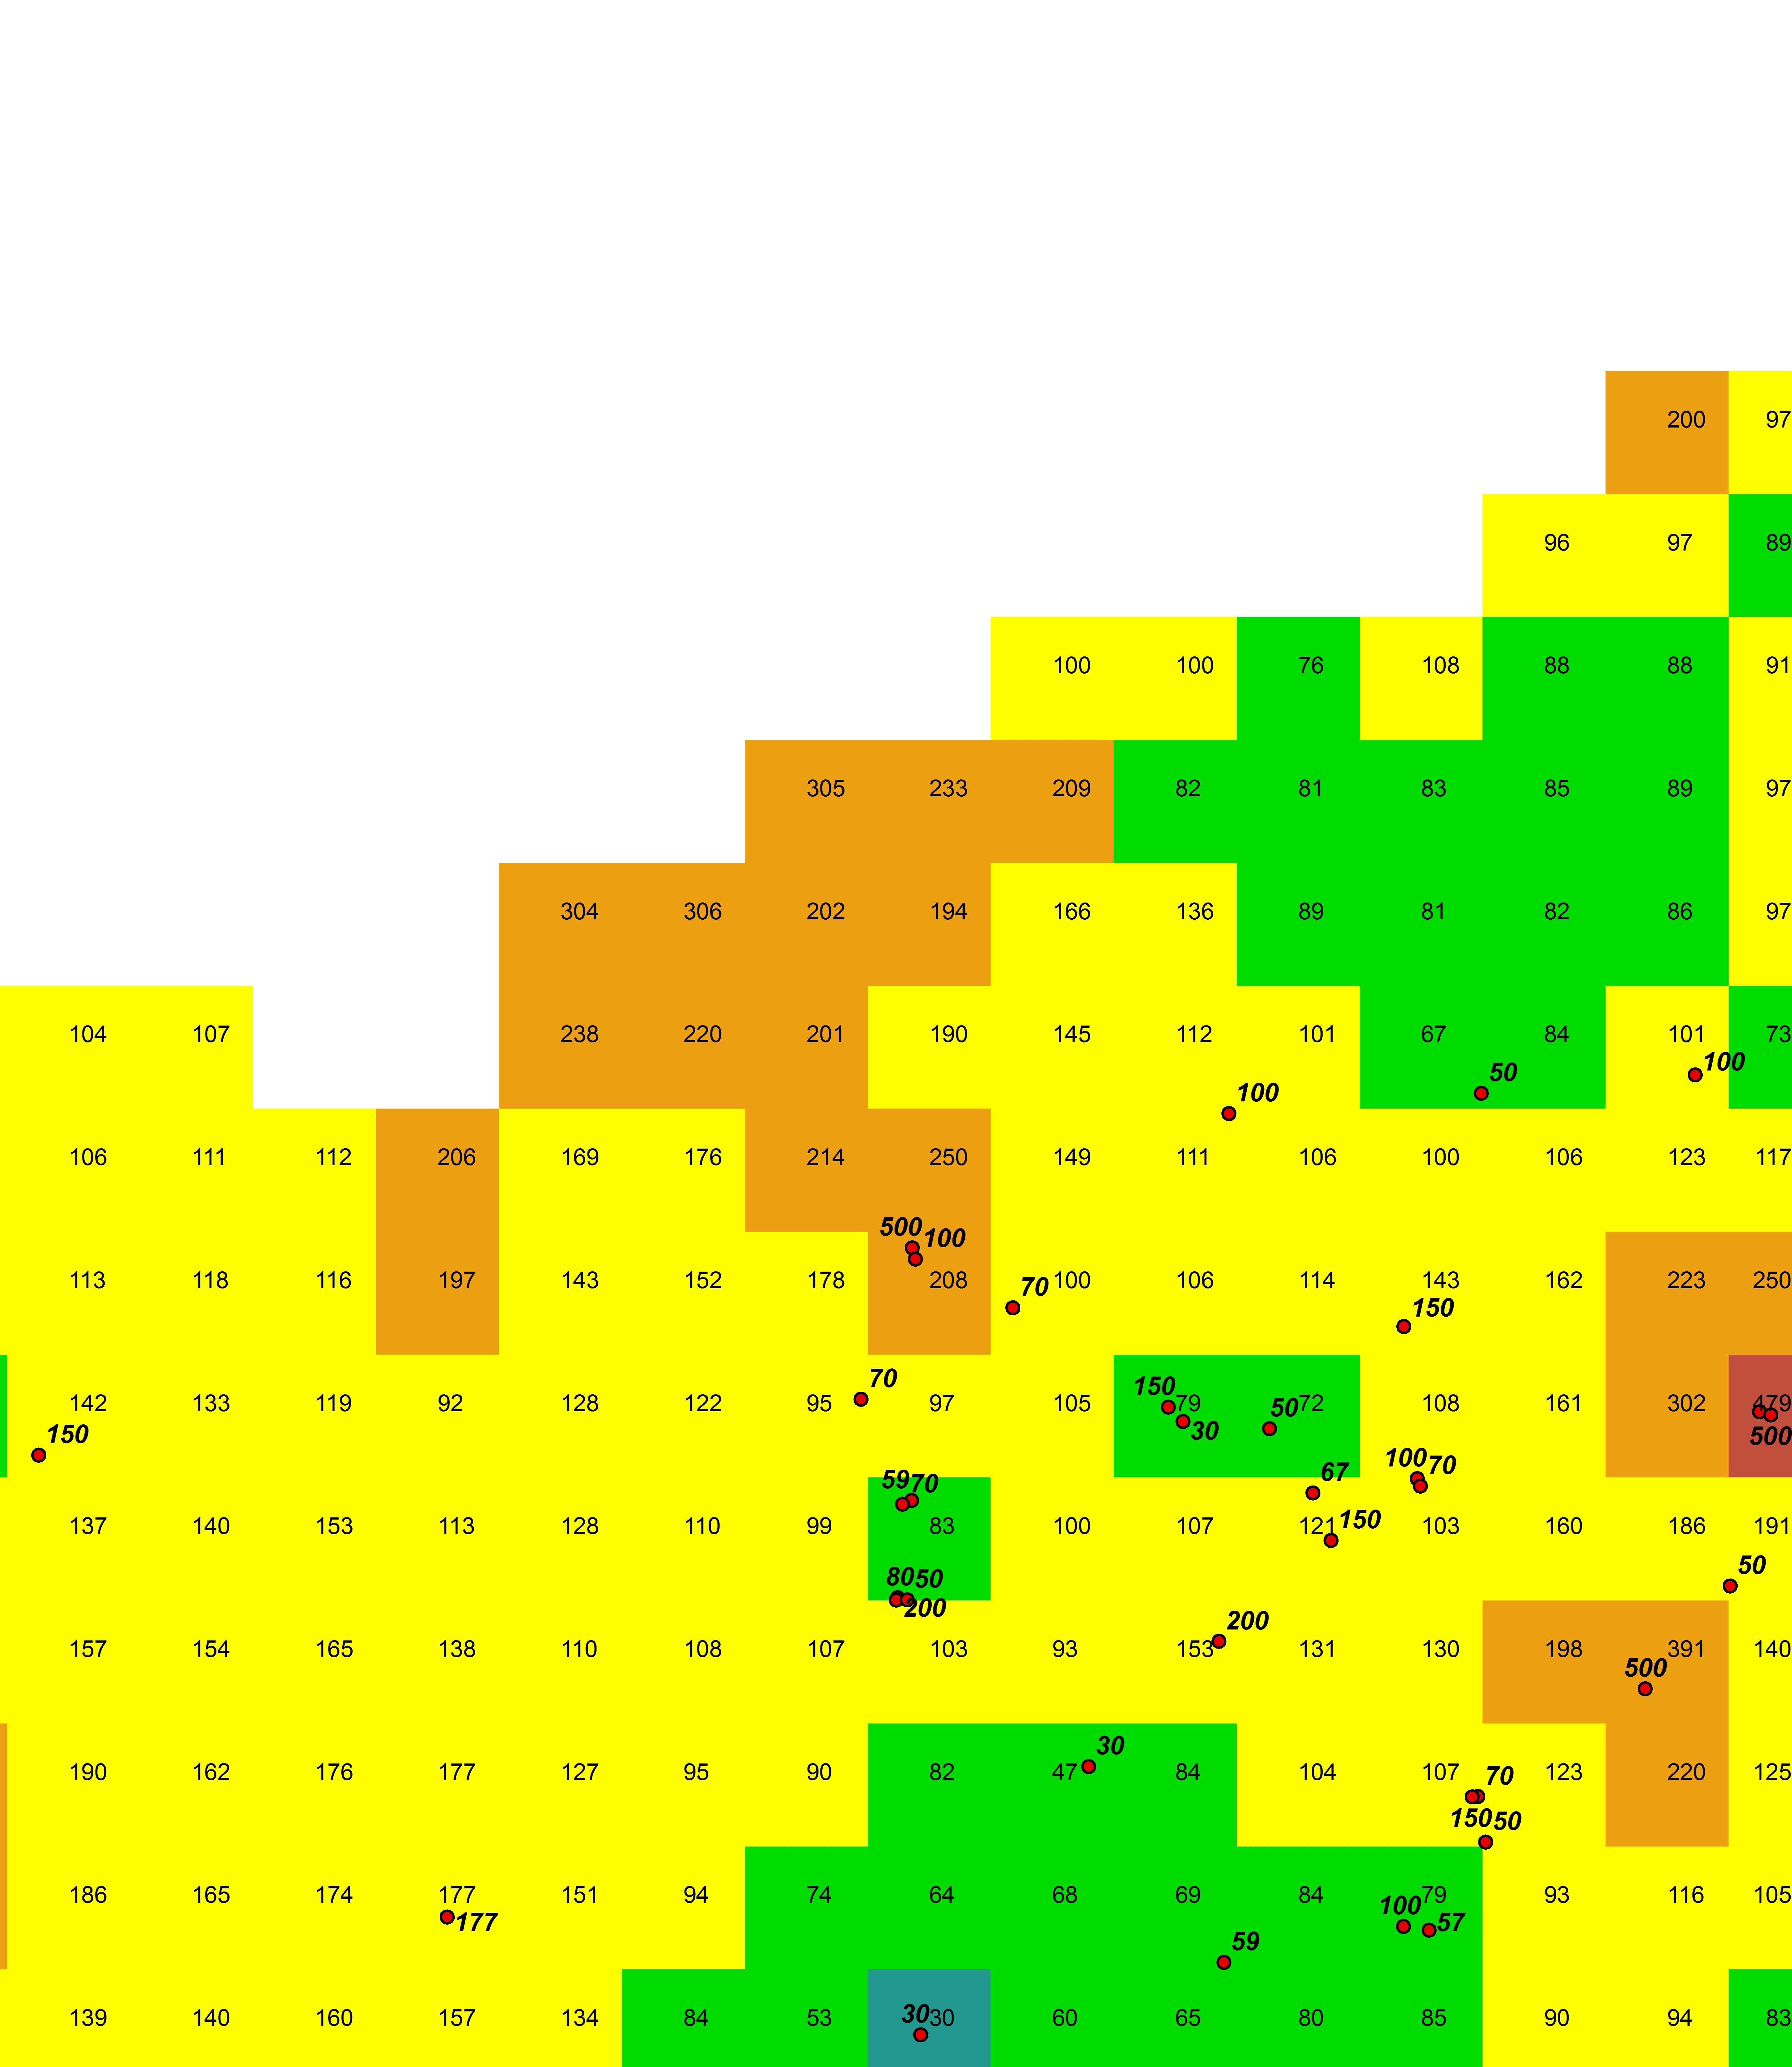
- Mark as New
- Bookmark
- Subscribe
- Mute
- Subscribe to RSS Feed
- Permalink
- Report Inappropriate Content
If you have access to the geostatistical analyst, you can explore the use and limitations of using IDW given certain data constraints. In any event, the help topic is informative
How inverse distance weighted interpolation works—Help | ArcGIS for Desktop
- Mark as New
- Bookmark
- Subscribe
- Mute
- Subscribe to RSS Feed
- Permalink
- Report Inappropriate Content
I suspect it is that only two points were found within the search radius How IDW works—Help | ArcGIS for Desktop
but if you read the text in fixed radius it isn't quite as clear as what you think. It is unfortunate that your observation points are sparse and when you do have them, they are closely spaced together. You have a good combination of unsatisfactory conditions particularly for an IDW that limits the search radius and number of points
- Mark as New
- Bookmark
- Subscribe
- Mute
- Subscribe to RSS Feed
- Permalink
- Report Inappropriate Content
As I understand it, IDW would extend the search radius if no data points are found within the specified search distance. Is not clear to me why there is a higher cell value with surrounding cells that are either lower than the 353 outlier or null values.
- Mark as New
- Bookmark
- Subscribe
- Mute
- Subscribe to RSS Feed
- Permalink
- Report Inappropriate Content
The governing equations are those in the geostats help topics which originate from
Burrough, P.A (plus various authors depending upon edition)
Principles of Geographical Information Systems, first edition 1986, 2nd 1998, 3rd 2014 page 163 in the latest. Wikipedia and many more cite the exact same equations.
The problem in using IDW give your point distribution, even if the search radius increases lies in the fact that the interpolate locations are for the most part far removed from the point locations. You would have to obtain what points were used in determining the value for that cell their distance to it and do the math. I suspect that the influence of that 353 value in the bigger picture of things is quite small. IDW is not the interpolator to use. In fact, I might even suggest that given tight point clustering and large distance between clusters is going to be difficult to interpolate anything meaningful other than as a mathematical venture. Other approaches like voronoi diagrams, various density calculations might lead to a more informative surface. Of course such conjectures could be mitigated by an understanding as to the purpose of the interpolated surface... is it to show pattern, containment, locality of occurence and a variety of other things. In any event, the math is available from a variety of sources and could be used to assess whether there is an error in the calculations or whether not enough information is provided to determine which points get included during a radius expansion. That is one reason that I suspect that the Geostatistical analyst offers more flexibility of weights, point inclusion and even such things as the directionality of inclusion.
- Mark as New
- Bookmark
- Subscribe
- Mute
- Subscribe to RSS Feed
- Permalink
- Report Inappropriate Content
That is strange behavior. The caveat at the end of the link Dan Patterson provided sort of sums it up:
When to use IDW
A surface calculated using IDW depends on the selection of the power value (p) and the search neighborhood strategy. IDW is an exact interpolator, where the maximum and minimum values (see diagram below) in the interpolated surface can only occur at sample points.
 Inverse Distance Weighted profile example
The output surface is sensitive to clustering and the presence of outliers. IDW assumes that the phenomenon being modeled is driven by local variation, which can be captured (modeled) by defining an adequate search neighborhood. Since IDW does not provide prediction standard errors, justifying the use of this model may be problematic.
How inverse distance weighted interpolation works—Help | ArcGIS for Desktop
Also, something to check (longshot). The ArcGIS 10.0 help offers this:
Some input datasets may have several points with the same x,y coordinates. If the values of the points at the common location are the same, they are considered duplicates and have no affect on the output. If the values are different, they are considered 'coincident' points.
The various interpolation tools may handle this data condition differently. For example, in some cases the first coincident point encountered is used for the calculation; in other cases the last point encountered is used. This may cause some locations in the output raster to have different values than what you might expect. The solution is to prepare your data by removing these coincident points. The Collect Events tool in the Spatial Statistics toolbox is useful for identifying any coincident points in your data.
ArcGIS Desktop ArcGIS 10.0 - IDW
Any chance you have coincident points?
Chris Donohue, GISP
- Mark as New
- Bookmark
- Subscribe
- Mute
- Subscribe to RSS Feed
- Permalink
- Report Inappropriate Content
I have checked the coincidence of data points with different values and it happens in a few cases somewhere else in the area but in those cases the resulting grid is approximated to the average of those points. I appreciate the suggestions to evaluate other methods and I have actually done it but I like the "control" we have in terms of restricting the extension of the search radius and having those cells with null values where there is no data while the other methods still interpolate over those areas. Perhaps I could just use one of those and build a buffering mask to clip the result. Independent of that, I still wonder why this abnormal high values show up.
- Mark as New
- Bookmark
- Subscribe
- Mute
- Subscribe to RSS Feed
- Permalink
- Report Inappropriate Content
Hi,
Maybe it have something to do with this:
recently I've been playing around trying understand the affect of Power in IDW
using a 2d excel simple example with 3 points.
I have found unexpected behaviour while the P =1 (actually any Odd power value gives quite similar strange result, but especially p=1)
Guess it may be kind of an explanation for the phenomenon you are describing.
