- Home
- :
- All Communities
- :
- Developers
- :
- Python
- :
- Python Questions
- :
- Graph preview in Python Toolbox
- Subscribe to RSS Feed
- Mark Topic as New
- Mark Topic as Read
- Float this Topic for Current User
- Bookmark
- Subscribe
- Mute
- Printer Friendly Page
Graph preview in Python Toolbox
- Mark as New
- Bookmark
- Subscribe
- Mute
- Subscribe to RSS Feed
- Permalink
Hello, please help.
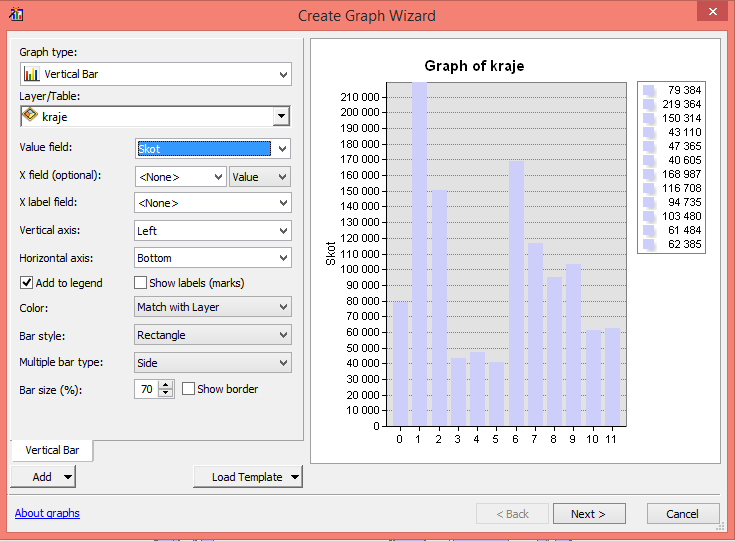
I need to create a toolbox in python, which will be used for making graphs. I need the parallel preview window during the graph creation. Half of the screen will be used for settings the parameters and the other half will be a preview that would change according to changes of parametres. Something like Create graph wizard in ArcGIS Desktop (picture below). Please if someone knows some code to split the screen, or some advices, web pages?
Thank you so much
Radka
- Mark as New
- Bookmark
- Subscribe
- Mute
- Subscribe to RSS Feed
- Permalink
There is no mention of a graphics interface for python toolboxes Comparing custom and Python toolboxes—Help | ArcGIS for Desktop
You will have to do the arcobjects thing, or if you want to stick with python, look to other libraries... MatPlotLib is the easiest and quickest to get up to speed on and It can be used with arcmap
- Mark as New
- Bookmark
- Subscribe
- Mute
- Subscribe to RSS Feed
- Permalink
This is not possible with a python toolbox.
You would need to do this in ArcObjects if you want to stay within the ArcGIS geoprocessing/addin framework. Alternatively you could develop a standalone UI using a graphics toolkit, such as PyQT/PySide and embed a matplotlib graph. Something similar to http://stackoverflow.com/questions/12459811/how-to-embed-matplotib-in-pyqt-for-dummies