- Home
- :
- All Communities
- :
- Products
- :
- ArcGIS Dashboards
- :
- ArcGIS Dashboards Questions
- :
- Multiple Views within a single dashboard
- Subscribe to RSS Feed
- Mark Topic as New
- Mark Topic as Read
- Float this Topic for Current User
- Bookmark
- Subscribe
- Mute
- Printer Friendly Page
- Mark as New
- Bookmark
- Subscribe
- Mute
- Subscribe to RSS Feed
- Permalink
In the water conservation webinar earlier they demonstrated a dashboard that had three large buttons across the top. Each button seemed to show three different operations dashboard within the single dashboard. For example one could be about work orders, one about public water advisories, and one about production facility status. Does anybody know where there is an example about how to do this?
Shane
Solved! Go to Solution.
Accepted Solutions
- Mark as New
- Bookmark
- Subscribe
- Mute
- Subscribe to RSS Feed
- Permalink
I see. Each one of these would be a separate dashboard then. You could have the same webmap in them or different ones, and set up the widgets accordingly.
The screenshot shows our web version of the Ops Dashboard running in the browser. Since each dashboard has a different webID from AGOL (and thus a different web address), you could write an HTML file with a few buttons that would control the call to each of the webmaps as you switch them along the top.
The other way you might be able to do this with no coding is using an Esri StoryMaps template and loading the dashboards in that way. I used the Tabbed Layout one and some public maps:
Hope this helps!
Chris
- Mark as New
- Bookmark
- Subscribe
- Mute
- Subscribe to RSS Feed
- Permalink
Hi Shane,
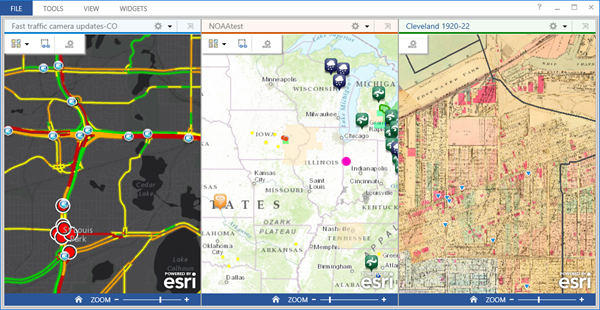
Yes, you can have multiple maps within the same view. You do this using the Multidisplay option when creating the Ops view. In there, you can add multiple map widgets, and you can link maps together (scale and zoom). Here's an example of using three maps within the same dashboard:
- Mark as New
- Bookmark
- Subscribe
- Mute
- Subscribe to RSS Feed
- Permalink
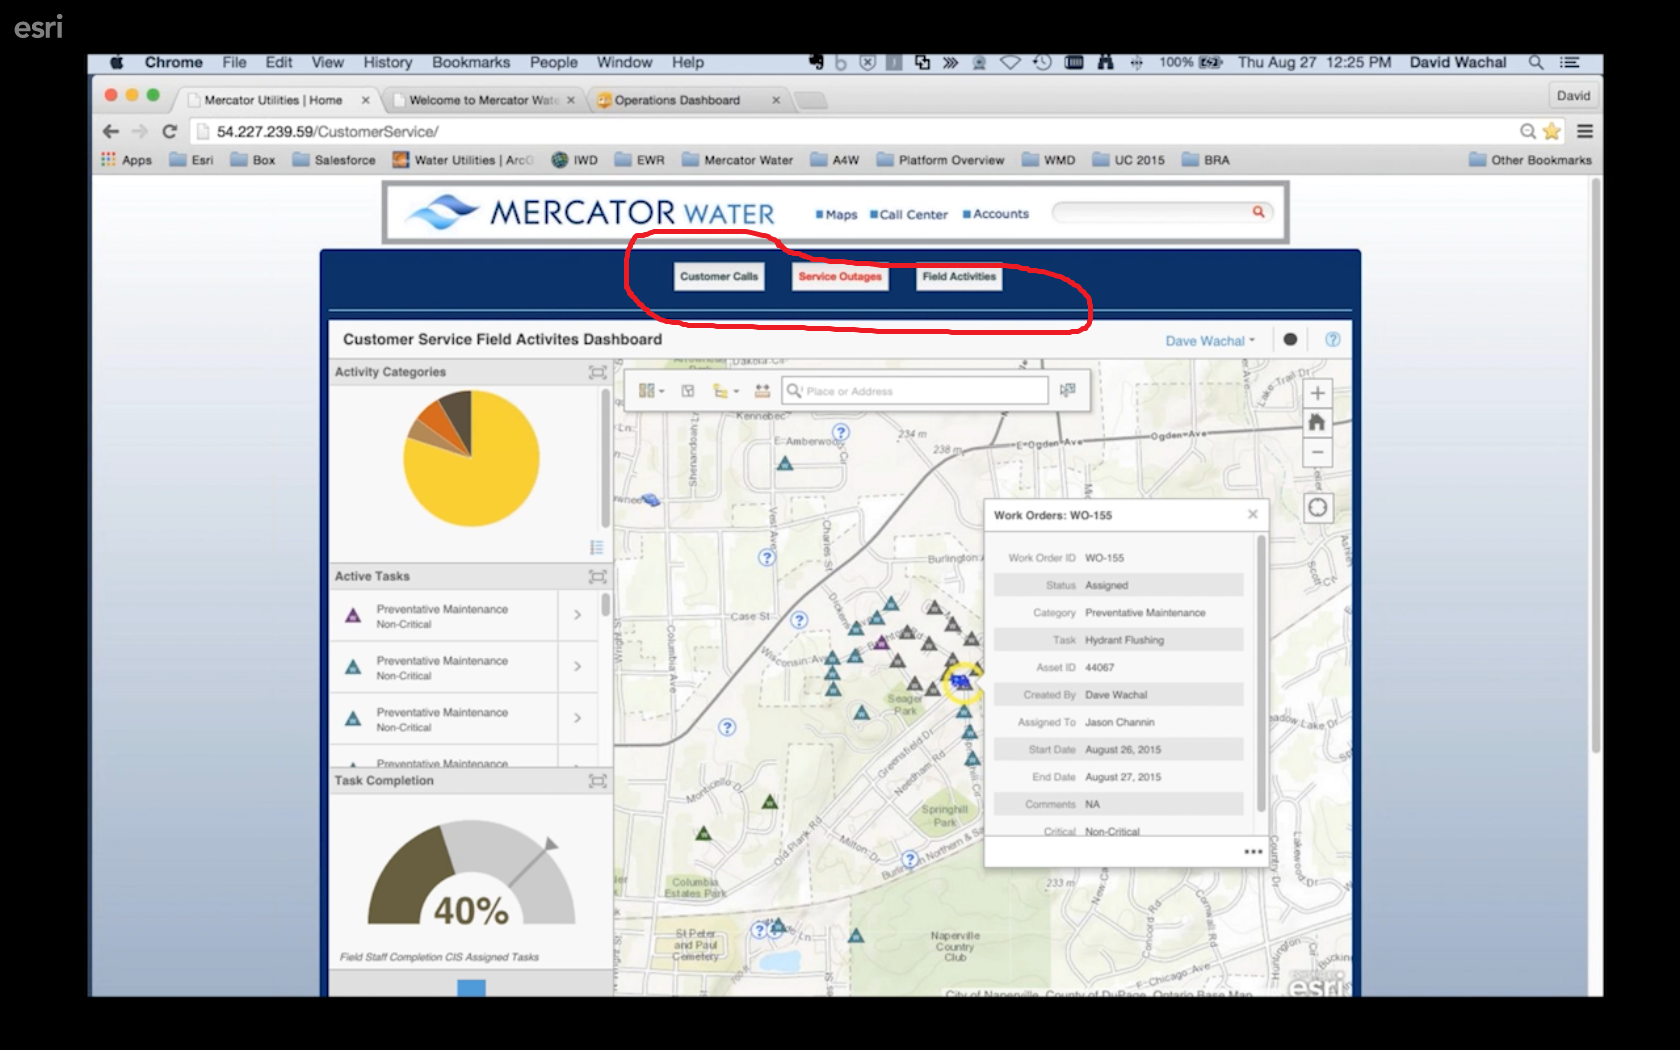
That looks good however I am looking more for a way to view them seperately. If you look at the image below you can see the three buttons. Each one is almost a seperate dashboard.
Shane
- Mark as New
- Bookmark
- Subscribe
- Mute
- Subscribe to RSS Feed
- Permalink
I see. Each one of these would be a separate dashboard then. You could have the same webmap in them or different ones, and set up the widgets accordingly.
The screenshot shows our web version of the Ops Dashboard running in the browser. Since each dashboard has a different webID from AGOL (and thus a different web address), you could write an HTML file with a few buttons that would control the call to each of the webmaps as you switch them along the top.
The other way you might be able to do this with no coding is using an Esri StoryMaps template and loading the dashboards in that way. I used the Tabbed Layout one and some public maps:
Hope this helps!
Chris
- Mark as New
- Bookmark
- Subscribe
- Mute
- Subscribe to RSS Feed
- Permalink
Hello Christopher,
How do you load a dashboard into one of the tabs in the Story Map template? I tried just using the URL of the browser version of the dashboard and putting it in the Story Map, but that didn't work.
Thanks!
- Mark as New
- Bookmark
- Subscribe
- Mute
- Subscribe to RSS Feed
- Permalink
Scratch that last question. I figured out it was because I was using "http" for the dashboard in a story map with "https". Have a good day!