- Home
- :
- All Communities
- :
- Products
- :
- Spatial Statistics
- :
- Spatial Statistics Questions
- :
- Combining a raster and shapefile datasets
- Subscribe to RSS Feed
- Mark Topic as New
- Mark Topic as Read
- Float this Topic for Current User
- Bookmark
- Subscribe
- Mute
- Printer Friendly Page
- Mark as New
- Bookmark
- Subscribe
- Mute
- Subscribe to RSS Feed
- Permalink
I have (1) a shapefile of US counties and (2) a raster dataset (.asc file) with hurricane risk, with values ranging from 1 to 10. I would like to calculate the mean hurricane risk for each county, but I have no idea how to do that - everything I have seen requires files to be of the same type. Any suggestions would be appreciated!
Solved! Go to Solution.
Accepted Solutions
- Mark as New
- Bookmark
- Subscribe
- Mute
- Subscribe to RSS Feed
- Permalink
Some tools "appear" to use both types such as
but ultimately for what you need to do, one format is best, which would be the grid and the above example is a starting point for refining your research
- Mark as New
- Bookmark
- Subscribe
- Mute
- Subscribe to RSS Feed
- Permalink
Some tools "appear" to use both types such as
but ultimately for what you need to do, one format is best, which would be the grid and the above example is a starting point for refining your research
- Mark as New
- Bookmark
- Subscribe
- Mute
- Subscribe to RSS Feed
- Permalink
I am curious why it would be best to have both files of raster type, in your opinion. Is there some intrinsic reason why it works better than using the shapefile as the zone data?
- Mark as New
- Bookmark
- Subscribe
- Mute
- Subscribe to RSS Feed
- Permalink
Yes...if you use a vector layer as the zones and a raster layer as the file being the subject of the summary can you answer the following:
- is the area of the vector layer area the same in raster as it is vector format?
- is the exact shape of the vector layer retained throughout the analysis?
- are the results of Zonal Statistics and Zonal Statistics as Table, using one statistic the same ? (for example mean or whatever)
- what happens if both layers are raster and they differ in cell size or are slightly misaligned?
- what if a vector zone has some really small areas?
- ...... many more questions here
If the user can't answer the above questions...plus more... then they haven't read this link
which explains those details that are separating them from their glee in obtaining an answer ... whether it is the most appropriate or not. Unfortunately you won't find those given as cavaets in any of the specific zonal tools but it is assumed that it has been read ... and rightly so. Perhaps a "quiz" prior to tool use might be a good idea 
- Mark as New
- Bookmark
- Subscribe
- Mute
- Subscribe to RSS Feed
- Permalink
Thank you, Dan! I first tried to use "Zonal Statistics as Table" without converting the shapefile (but ensuring that the two files had the same projection). That resulted in an unhelpful message that “Background processing has encountered a serious error and is unable to continue”, with no other error messages and no output file. Once I converted the polygon to a raster, however, I was able to create the statistics table without a problem. Thank you for the help!
- Mark as New
- Bookmark
- Subscribe
- Mute
- Subscribe to RSS Feed
- Permalink
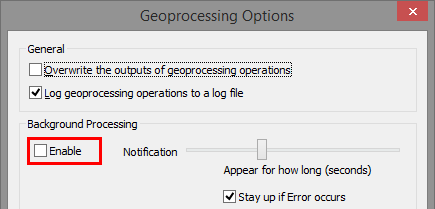
Glad you resolved it. As a side note, the “Background processing has encountered a serious error and is unable to continue” error can normally be avoided if background geoprocessing is switch off. Enter the Geoprocessing menu and select "Geoprocessing options..." and unmark the option "Enable".
- Mark as New
- Bookmark
- Subscribe
- Mute
- Subscribe to RSS Feed
- Permalink
As Dan Patterson explains, there are tools that combine raster and vector formats. Especially the tools you want does this. You can even use the ASCII raster as input. However, does this file have a .prj file too? The .prj contains the projection information which ArcMap uses to locate the coordinates on the globe. Make sure you work with the same coordinate system for both your counties featureclass as the raster (.asc).
If you don't have a .prj file you will first want to use the Define Projection tool to assign the appropriate coordinate system for it. In case it is different from the counties you want to project the raster to the coordinate system of the counties.
From the tools Dan Patterson suggested I think the Zonal Statistics As Table is the most appropriate tool. It requires the Spatial Analyst extension. It will create a table that you can join back to the counties featureclass.
- Mark as New
- Bookmark
- Subscribe
- Mute
- Subscribe to RSS Feed
- Permalink
The crux of this problem is the conversion of the feature class to raster. As Dan pointed out.
The Zonal tools will internally convert the features to raster using the FeatureToRaster tool, which actually calls the PolygonToRaster tool using the CELL_CENTER option.
However, you could do the conversion yourself and choose to rather use the MAX_AREA option or you could specify a PRIORITY field.
-Steve