- Home
- :
- All Communities
- :
- User Groups
- :
- Web AppBuilder Custom Widgets
- :
- Documents
- :
- Bar Chart Cedar Widget v1.3 - 04/18/2018
- Subscribe to RSS Feed
- Mark as New
- Mark as Read
- Bookmark
- Subscribe
- Printer Friendly Page
- Report Inappropriate Content
Bar Chart Cedar Widget v1.3 - 04/18/2018
Bar Chart Cedar Widget v1.3 - 04/18/2018
Hi all,
I want to share with all the comunity a widget I have developed (WAB 2.6); create graphs of your map services on the fly using Cedar. You can select the available layers in the Web Map. Choose, for the 'x' axis, the field you want to show information, repeat the procedure for the 'y' axis. Select the type of graphic, bars or horizontal bars. The widget is ready to filter the data by extension (by activating the check button). Inside the container of the widget, the graphic will be updated being this responsive.
Don't forget to add the Cedar dependencies. How to add other libraries to WAB?
I added the following dependencies in the 'index.html' file of the app:
- <script type="text/javascript" src="https://cdnjs.cloudflare.com/ajax/libs/d3/3.5.6/d3.min.js"></script>
- <script type="text/javascript" src="https://cdnjs.cloudflare.com/ajax/libs/vega/2.6.1/vega.min.js"></script>
- <script type="text/javascript" src="https://unpkg.com/arcgis-cedar@0.9.1/dist/cedar.min.js"></script>
Version 1.1, pending improvements. All suggestions for improvement will be welcome.
List of the latest enhancements and changes:
- Added a new class => select the layers ids from the Web Map (Dojo Select)
- Geometry icons at layer selector; geometry selector (now => "*")
Live demo here!
I build Esri widgets without any -economic- interest, if you find it useful for your projects, you can buy me a coffee 
Don't hesitate to contact me if you need some custom developments: biotekgis@gmail.com
Cheers!
- Mark as Read
- Mark as New
- Bookmark
- Permalink
- Report Inappropriate Content
- Mark as Read
- Mark as New
- Bookmark
- Permalink
- Report Inappropriate Content
Hi ,
it doesn't work .
- Mark as Read
- Mark as New
- Bookmark
- Permalink
- Report Inappropriate Content
As you can see in the demo, it works. It contains the same widget as the post's attachment.
Best
A.
- Mark as Read
- Mark as New
- Bookmark
- Permalink
- Report Inappropriate Content
Hi ,
i download the same attatchment but it doesn't work . 
- Mark as Read
- Mark as New
- Bookmark
- Permalink
- Report Inappropriate Content
Tell me more, because I don't understand... What kind of error are you receiving? The widget is developed for WAB 2.6; just add the widget folder to 'stemapp' folder and don't forget to add the Cedar dependencies.
Best
A.
- Mark as Read
- Mark as New
- Bookmark
- Permalink
- Report Inappropriate Content
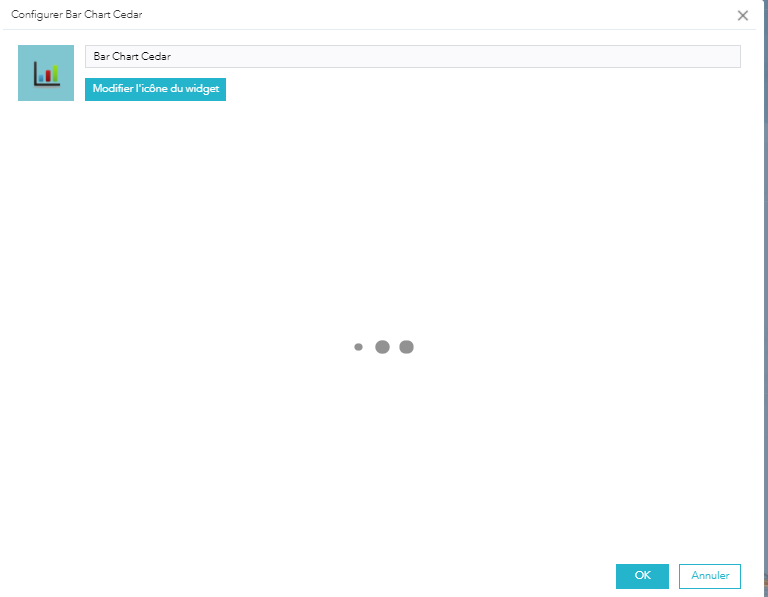
Hi ,
When i add this widget i can't configure it . it is bloqued here .
- Mark as Read
- Mark as New
- Bookmark
- Permalink
- Report Inappropriate Content
This widget has no configuration (there is not 'settings' folder); could you click 'OK'? Anyway, I just updated the attachment for delete your error!
- Mark as Read
- Mark as New
- Bookmark
- Permalink
- Report Inappropriate Content
I can click OK but there is no layer .
- Mark as Read
- Mark as New
- Bookmark
- Permalink
- Report Inappropriate Content
Probably your Web Map has no layers; the widget reads the Web Map layers
- Mark as Read
- Mark as New
- Bookmark
- Permalink
- Report Inappropriate Content
Hi ,
it is Ok . It works only with feature service . Please is there any enhancements and changes to get other graphics type (pie , line , ....)
- Mark as Read
- Mark as New
- Bookmark
- Permalink
- Report Inappropriate Content
It works with Map Server and Feature Service. Now the app is consuming 'https://sampleserver6.arcgisonline.com/arcgis/rest/services/USA/MapServer/0' as well.
I'm planing to continue adding new functionalities to this widget and share it with whole community; for the moment I have a lot of private work. But I will.
The next improvements probably will be the hability to create line charts and consume tables (alphanumeric).

Best
A.
- Mark as Read
- Mark as New
- Bookmark
- Permalink
- Report Inappropriate Content
Thank you so much Adric2c .
- Mark as Read
- Mark as New
- Bookmark
- Permalink
- Report Inappropriate Content
Hi ,
Please is there any enhancements and changes to get other graphics type (pie , line , ....)
- Mark as Read
- Mark as New
- Bookmark
- Permalink
- Report Inappropriate Content
Hi ,
Can you help to resolve this error .When i choose the same country , the result will be duplicated .
<!DOCTYPE html>
<html lang="fr">
<head>
<meta charset="UTF-8">
<link href="https://netdna.bootstrapcdn.com/twitter-bootstrap/2.3.2/css/bootstrap-combined.min.css" rel="stylesheet">
<script src="http://serverapi.arcgisonline.com/jsapi/arcgis/3.5"></script>
<script src="http://code.angularjs.org/1.5.8/angular.js"></script>
<script src="./../../highcharts/util.js"></script>
<!--script src="http://code.highcharts.com/4.2.2/highcharts.js"></script!-->
<!--script src="http://code.highcharts.com/highcharts.js"></script!-->
<!--script src="https://rawgithub.com/pablojim/highcharts-ng/master/dist/highcharts-ng.js"></script!-->
<script src="./../../highcharts-ng/dist/highcharts-ng.js"></script>
<script src="http://code.highcharts.com/4.2.2/modules/exporting.js"></script>
<script src="http://code.highcharts.com/4.2.2/modules/offline-exporting.js"></script>
</head>
<body>
<div ng-app="myapp">
<div ng-controller="myctrl">
<select ng-model="highchartsNG.options.chart.type" ng-options="t.id as t.title for t in chartTypes">
<option value="">-- Choisir type de graphe --</option>
</select>
<select ng-options="t as t.name for t in chartSeries" ng-model="item" ng-change="addSeries(item)">
<option value="">-- Choisir Gouvernorat --</option>
</select>
<highchart id="chart1" config="highchartsNG"></highchart>
</div>
<!div style="width:840px;height:600px;border: 2px solid #0F0F0F;margin: 0 auto;">
</div>
<script type="text/javascript">
var myapp = angular.module('myapp', ["highcharts-ng"]);
myapp.controller('myctrl', function ($scope) {
dojo.require("esri.map");
dojo.require("dojo.parser");
dojo.require("esri.tasks.query");
dojo.require("dojo.date.locale");
dojo.require("dojo.DeferredList");
$scope.chartTypes = [
{"id": "line", "title": "Lignes"},
{"id": "spline", "title": "Courbes"},
{"id": "column", "title": "Histogrammes"},
{"id": "bar", "title": "Barres"},
{"id": "scatter", "title": "Points"}
]
// pour traiter Object.values
if(!Object.values){Object.values=obj=>Object.keys(obj).map(key=>obj[key])};
var rqResults = [];
var datas = [];
var names = [];
var data_t = [];
var SERVERPATH = "http://41.231.36.249/sirgeo/rest/services";
dojo.ready(getGraphData);
function getGraphData() {
query = new esri.tasks.Query();
query.outFields = ["NOM", "PopTot2004", "PopTot2005", "PopTot2006", "PopTot2007", "PopTot2008", "PopTot2009", "PopTot2010", "PopTot2011", "PopTot2012", "PopTot2013", "PopTot2014"];
query.returnGeometry = false;
query.where = "1=1";
qSensor = new esri.tasks.QueryTask(SERVERPATH + "/SIR-Gouv/demographie_gouv/MapServer/0");
qSensor.execute(query, getGraphResults);
}
function getGraphResults(results) {
rqResults = results.features;
leng = rqResults.length;
var featureAttributes = [];
for (var i = 0; i < leng; i++) {
featureAttributes.push(results.features.attributes);
var featureAttributes_2;
featureAttributes_2 = JSON.parse(JSON.stringify(featureAttributes));
delete featureAttributes_2.NOM;
var myObj = new Object();
var name = featureAttributes.NOM;
var pop = Object.values(featureAttributes_2);
var date = Object.keys(featureAttributes_2);
var year = [];
var year2 = [];
for (var k=0; k < date.length; k++)
{ year
// year2
year2
};
myObj.id = i;
myObj.name = name;
myObj.data = pop;
myObj.year = year2;
data_t = myObj.year;
switch(myObj.id) {
case i:
names = myObj.name;
datas = myObj.data;
break;
}
};
$scope.chartSeries = [];
for (var i = 0; i < leng; i++) {
$scope.chartSeries.push({id:i, name: names[leng-1-i], data: datas[leng-1-i]});
};
// $scope.selectdata= $scope.chartSeries[0];
$scope.addSeries = function () {
var named = [];
var rnd = [];
for (var i = 0; i < leng; i++) {
switch($scope.item.id) {
case i:
named = $scope.item.name;
rnd = $scope.item.data;
$scope.highchartsNG.series.push({
name: named, data: rnd
})
break;
}
}
};
$scope.highchartsNG = {
options: {
chart: {
type: 'line'
},
plotOptions: {
line: {
connectNulls: true
},
spline: {
connectNulls: true
}
}
},
series: [],
//series: $scope.chartSeries,
title: {
text: 'Population Totale',
// x: 0//center
},
loading: false,
legend: {
enabled: true
},
xAxis: {
title: {
text: 'Ann\351es',
style: {
color: 'black',
fontWeight: 'bold'
}
},
categories: data_t,
lineWidth: 1,
lineColor: 'black'
},
yAxis: {
title: {
text: 'Population totale',
style: {
color: 'black',
fontWeight: 'bold'
}
},
labels: {
format: '{value:,.0f}'
},
lineWidth: 1,
lineColor: 'black',
minorGridLineWidth: 0,
gridLineWidth: 1,
alternateGridColor: null,
startOnTick: true,
endOnTick: true
},
tooltip: {
pointFormat: 'Value: {point.y:,.0f} habitants'
},
}
}
});
</script>
</body>
</html>
- Mark as Read
- Mark as New
- Bookmark
- Permalink
- Report Inappropriate Content
Hey!
I'll help you, AngularJS is funny. Now I have a lot to do sorry.
But I do have one recommendaton to make, edit your post and delete the path server... Now it's open and anybody can play with your data..
Cheers
- Mark as Read
- Mark as New
- Bookmark
- Permalink
- Report Inappropriate Content
Thank you so much .
- Mark as Read
- Mark as New
- Bookmark
- Permalink
- Report Inappropriate Content
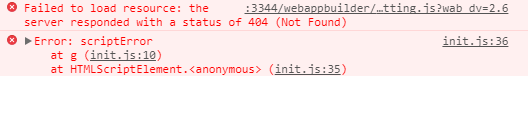
Hi there, I have been trying to add the widget without much luck. When I click execute I am having the following output in the console.

Does anyone have any suggestion of how to solve this?
I have added the cedar, d3 and vega to the lib folder in ..client/stemapp as well as adding them to the init.js
Thank you.
- Mark as Read
- Mark as New
- Bookmark
- Permalink
- Report Inappropriate Content
Hi ,
Please can you help me to disable selected options in ng option angular js .
<select ng-options="t as t.name for t in chartSeries " ng-model="item" ng-change="addSeries(item)">
<option value="" >-- Choisir Gouvernorat --</option>
</select>
- Mark as Read
- Mark as New
- Bookmark
- Permalink
- Report Inappropriate Content
please can you help to resolve this prob . The chart is duplicated when i choose the same country .
this is the link of my application