- Home
- :
- All Communities
- :
- User Groups
- :
- Web AppBuilder Custom Widgets
- :
- Questions
- :
- Re: Time Slider Widget Customization - Single hand...
- Subscribe to RSS Feed
- Mark Topic as New
- Mark Topic as Read
- Float this Topic for Current User
- Bookmark
- Subscribe
- Mute
- Printer Friendly Page
Time Slider Widget Customization - Single handle
- Mark as New
- Bookmark
- Subscribe
- Mute
- Subscribe to RSS Feed
- Permalink
The Time Slider widget appears with two handles or thumbs to define the time period shown on the map. However in many cases for historical data we want to show a "snapshot" i.e. the situation at a single point in time, not over a period, and certainly not over an adjustable period. For example, to show a single census year's data you don't want to bracket more than one decade. The two handles can be brought together, but this may be confusing for the user. I have looked into the Time Slider widget code but cannot find a straightforward way of customizing this. I have also looked through the list of custom Widgets and cannot find it. Anyone tried this or can point me in the right direction? thanks.
- Mark as New
- Bookmark
- Subscribe
- Mute
- Subscribe to RSS Feed
- Permalink
I have a similar use-case, trying to display data by month. At this point, the default time range will include two months at a time, meaning that one month of the year will be left out. Interested to hear if you or anyone has found a solution to displaying data in a "snapshot" rather than as a range.
- Mark as New
- Bookmark
- Subscribe
- Mute
- Subscribe to RSS Feed
- Permalink
Hi Galen:
I tried a number of things, and also mounted a question to this site. Finally I was directed to an alternative in the Javascript API by an ESRI staff member. This seems custom-made for the situation where one wants the time slider to reference a single date or time rather than a range. It is counter intuitive in that it only works when the time layer on the map is configured as cumulative or "progressive." It is the timeSlider.singleThumbAsTimeInstant() function. See:
TimeSlider | API Reference | ArcGIS API for JavaScript 3.21
Modify the createTimeSlider() function in Widget.js by adding the bottom line below (around line 299):
...
this.timeSlider.setThumbMovingRate(props.thumbMovingRate);
this.timeSlider.singleThumbAsTimeInstant(true);
Cheers
- Mark as New
- Bookmark
- Subscribe
- Mute
- Subscribe to RSS Feed
- Permalink
Hi,
I had the same problem recently and I believe I may have figured out a solution to this particular issue. Within the map layer that powers the web app you have the following settings at the bottom of the layer screen:

Once you open that up you may go further down in "Show advanced options":
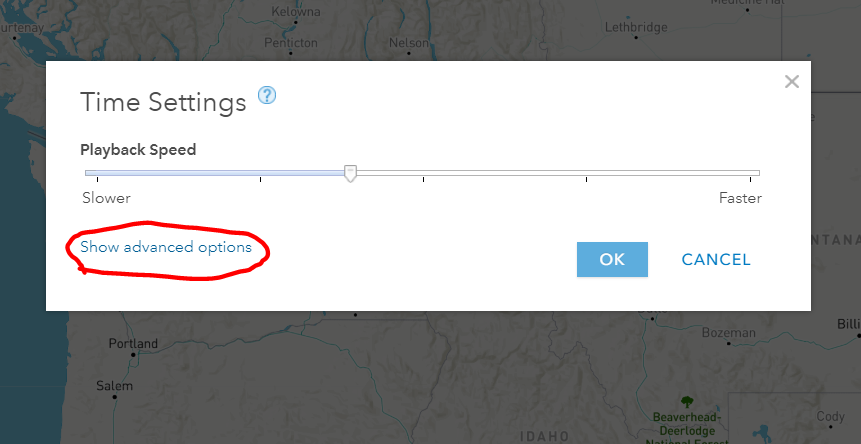
Finally, I set that I want the "Start playback at" to "playback position saved with map", as shown below:
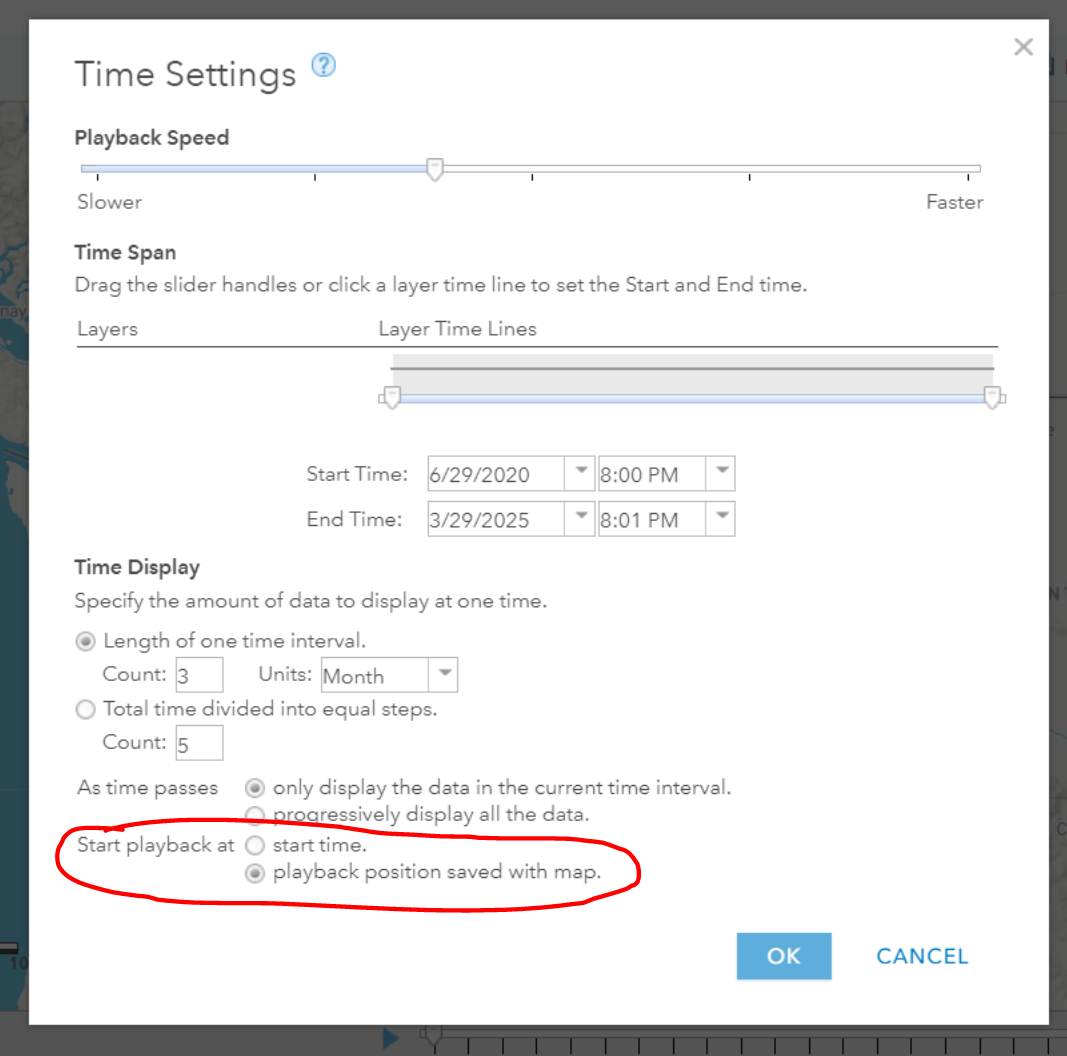
And made sure that whatever I had in that underlying map was what I wanted to be default in the web app (collapsed the ticks on top of each other).
Although this gave me quite reasonable results, I would say it was counter intuitive to have to set that in the underlying layer level as opposed to the "Time Slider" widget within the web app builder. Something for ESRI to consider in the future.