- Home
- :
- All Communities
- :
- User Groups
- :
- Web AppBuilder Custom Widgets
- :
- Questions
- :
- Questions about Robert Scheitlin's Identify Widge...
- Subscribe to RSS Feed
- Mark Topic as New
- Mark Topic as Read
- Float this Topic for Current User
- Bookmark
- Subscribe
- Mute
- Printer Friendly Page
Questions about Robert Scheitlin's Identify Widget
- Mark as New
- Bookmark
- Subscribe
- Mute
- Subscribe to RSS Feed
- Permalink
First let me say that I am totally new to the Esri Web AppBuilder world and widgets but I find it fascinating and I am looking forward to learning more. Please forgive me for any awkward phrasing or incorrect terminology.
Let me also say that I am very impressed with Robert Scheitlin, GISP and his awesome Widgets. I am especially very keen on his Identify Widget. I am hoping to be able to make a few modifications that will help make it a very useful tool for me.
I hope to use the widget by being able to select a point on the map and having the widget display all of the Administrative Polygons the point is contained in. The polygons are simple: State, County, Township, City, Village, etc.. And the widget does exactly that out of the box.
That said, here are a few questions which I hope some kind developer's could assist me with:
- I was hoping that I could control the order in which the Admin Polygons are displayed in the results. However, no matter what I attempt (using the Layer Name Up/Down arrows in the widget configuration or manually editing the order in the config_Identify.json file), the results seem to display in whatever order they want. Is this the way it is or am I overlooking something? I have attached an example showing the results and the Layer Names in the configuration.
- In addition to displaying the Admin Polygons in the Results tab, it would also be helpful (at least to me) to also display the actual Longitude-Latitude value as the first entry in the Results tab. Has anyone already done this? And which files (json, js, html, config) would changes need to be made in order to do this? I have attached an example of what I would like to see.
- It would also be very nice to be able to have a "Copy and Paste" button, link, etc. included on the Results tab which would copy the text Results as a comma or tab-delimited file so that they could be pasted in an Excel file, Notepad, or Email. Has anyone made that type of change to the Identify Widget?
I would really appreciate any help or any links which might help me understand what I am doing wrong (#1) or how I might be able to implement (#'s 2 and 3).
Thanks
Solved! Go to Solution.
Accepted Solutions
- Mark as New
- Bookmark
- Subscribe
- Mute
- Subscribe to RSS Feed
- Permalink
Larry,
- It is working as designed. The widget will execute the QueryTask or IdentifyTask (based on the layer type) and the time that the server takes to respond to the request will determine the ordering of the results in the results pane. In order to fix this I would have to wait for all responses to come back and them sort the order based on the configured order. This would work in a lot of configurations but those who have hundreds of layer configured to be identified (which a lot more of my users do then I ever expected) they would have to wait for some time before any results are displayed. Right now this is just not in my plan for this widget.
- I can see where this may be useful but everyone does not only use the point identify tool there is all the other types of geometries to contend with. Would you just want to see the centroid lat lon for those other geometry types?
- This would be difficult as each result will likely have a different schema (i.e different fields) so that would mean I would have to produce a different CSV for each different result schema. My eSearch widget has an export to CSV option because it only deals with on schema configuration at a time (i.e it only searches on layer at a time).
- Mark as New
- Bookmark
- Subscribe
- Mute
- Subscribe to RSS Feed
- Permalink
Robert,
Thanks for personally responding to my questions. That was an unexpected surprise.
1) I understand what you're saying. I have seen other examples of your widget in use with projects containing a large number of layers. In my case, I have only about 10 different polygon layers. The results come back almost instantaneously which was the reason I asked if I was doing something wrong. I'm sure if I had 100 or more layers, the response would not be so quick. It would be nice if it was perhaps an option for users like me (if there were any) who would prefer to have the results follow the Layer Names in the Configuration.
2) Yes. For me, I could see the centroid lat lon for other geometry types as being helpful and the actual lat lon for where the identified point was placed.
3) I was a little hopeful that this might be something that could be done but I wasn't sure how the data was being handled/processed before displaying them into the Results tab. I'm a simple guy and that doesn't always equate to the sophisticated coding that I see in other works. I thought it might be easy to concatenate each Layer's Name, Alias, and Value to a string while writing it out to the Results display. Then the string could be copied to the clipboard or something like that. But then I don't know enough to about JS right now to know if that could be done. Only enough to be dangerous.
Thanks again for taking the time to respond. At least I have a little better understanding of your widget. It is still pretty cool!
Larry
- Mark as New
- Bookmark
- Subscribe
- Mute
- Subscribe to RSS Feed
- Permalink
Larry,
For number 2 here is some code to change in the Widget.js IdentifyFeatures function. Add lines 10 - 26.
identifyFeatures: function(geom){
this.numServicesIdent = 0;
this.identifyResultsArray = [];
this.iResultLen = 0;
this.resultFound = false;
this.list.clear();
this.tabContainer.selectTab(this.nls.resultslabel);
html.setStyle(this.progressBar.domNode, 'display', 'block');
html.setStyle(this.divResult, 'display', 'none');
if(geom.type === 'point'){
var idResult = {};
var rsltContent = '';
idResult.icon = this.folderUrl + 'images/i_info.png';
idResult.title = "User Selected Point";
var value = this._formatNumber(geom.getLongitude(), 4, null, null) + ", " + this._formatNumber(geom.getLatitude(), 4, null, null);
rsltContent = this.resultFormatString.replace('[attribname]', 'Longitude-Latitude').replace('[attribvalue]', value);
if(rsltContent.lastIndexOf('<br>') === (rsltContent.length - 4)){
idResult.rsltcontent = rsltContent.substr(0, rsltContent.length - 4);
}else{
idResult.rsltcontent = rsltContent;
}
idResult.zoom2msg = '';
idResult.removeResultMsg = '';
idResult.sym = this.resultSym;
this.list.add(idResult);
}
...- Mark as New
- Bookmark
- Subscribe
- Mute
- Subscribe to RSS Feed
- Permalink
Wow! That was slick! Thank you, Mr. Scheitlin!
larry
- Mark as New
- Bookmark
- Subscribe
- Mute
- Subscribe to RSS Feed
- Permalink
Hi Robert,
I think I would like to place a symbol at the User Selected Point (Red Stick Pin). Would this block of code be the appropriate place to accomplish that or would you recommend someplace else with the widget.js?
larry
- Mark as New
- Bookmark
- Subscribe
- Mute
- Subscribe to RSS Feed
- Permalink
Larry,
It would be the appropriate location. You would need to add the graphic to the GL.
this.graphicsLayer.add(iGra);and add the graphic to the idResult
idResult.graphic = iGra;- Mark as New
- Bookmark
- Subscribe
- Mute
- Subscribe to RSS Feed
- Permalink
Hi Robert,
I have been playing around with this all day but something is either wrong or I am to much of a newbie to understand what is happening. I added the two lines of code within the block of code.

And the best result I can get is this:
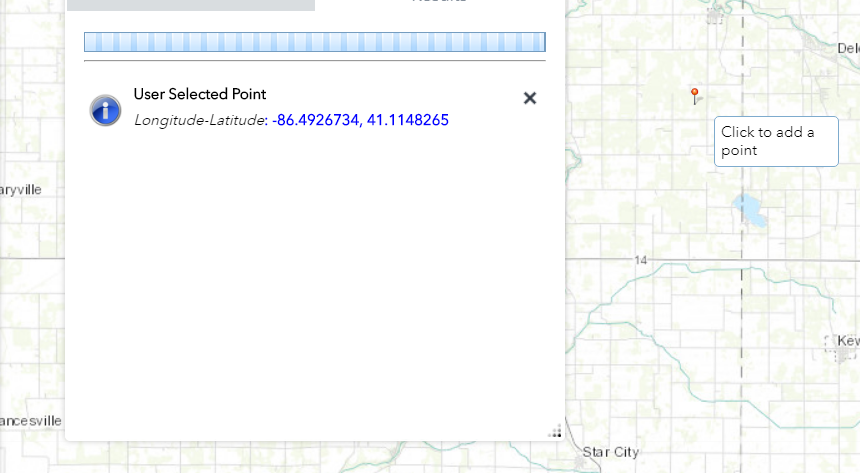
I get the StickPin marker and I get the Lon-Lat values. No other data displays. And the progress bar at the top just continually grinds. It almost seems that the two lines of code are stepping on the rest of the attributes being processed.
I'm really overlooking something simple, right?
larry
- Mark as New
- Bookmark
- Subscribe
- Mute
- Subscribe to RSS Feed
- Permalink
Larry,
What error(s) are shown in the browsers console?
- Mark as New
- Bookmark
- Subscribe
- Mute
- Subscribe to RSS Feed
- Permalink
Checking it out now.