- Home
- :
- All Communities
- :
- User Groups
- :
- Web AppBuilder Custom Widgets
- :
- Questions
- :
- How to delete lines in Chart widget
- Subscribe to RSS Feed
- Mark Topic as New
- Mark Topic as Read
- Float this Topic for Current User
- Bookmark
- Subscribe
- Mute
- Printer Friendly Page
How to delete lines in Chart widget
- Mark as New
- Bookmark
- Subscribe
- Mute
- Subscribe to RSS Feed
- Permalink
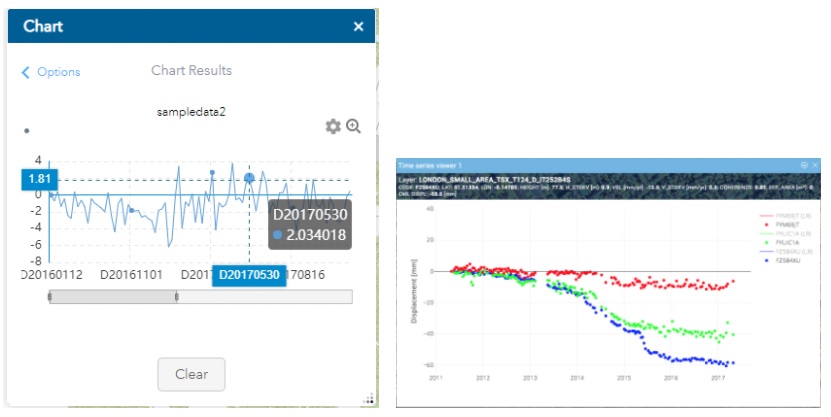
I am using chart widget to generate line charts. It is running fine, but my client wants to be simple so I follow this useful post that solve most of client requirements (Thanks @RobertScheitlin__GISP )
Now, I have to remove default lines in chart and only show points (vertexs).
The file attached shows in the first image the line chart that I have, but client wants charts like second image: chart showing a scatter plot for more that one point selected.

I have just seen in OperationsDashboards help: https://doc.arcgis.com/en/dashboards/get-started/serial-chart.htm that it is possible to create a chart with multiple lines.
Is it possible to do with Chart Widget in Web AppBuilder ? Or, is it possible to use a Dashboard widget as a WebAppBuilder custom widget ?
Please suggest me how can I do. Thank you in advance !
- Mark as New
- Bookmark
- Subscribe
- Mute
- Subscribe to RSS Feed
- Permalink
In case it helps someone, I have finally removed default lines in Chart widget setting width style to 0 in config.json file.
I'm still working to show multiple point series in Chart, but I guess that it is not possible because there is this property defined in widget.js: noMoreThanOneChartClassName: "no-more-than-one-chart",
I'm not a JS developer, so if someone could confirm this and give some help in this matter it would be of great help. Thank you!