- Home
- :
- All Communities
- :
- User Groups
- :
- Web AppBuilder Custom Widgets
- :
- Questions
- :
- eDraw widget
- Subscribe to RSS Feed
- Mark Topic as New
- Mark Topic as Read
- Float this Topic for Current User
- Bookmark
- Subscribe
- Mute
- Printer Friendly Page
eDraw widget
- Mark as New
- Bookmark
- Subscribe
- Mute
- Subscribe to RSS Feed
- Permalink
Ehanced draw widget for WebApp Builder for Arcgis
UPDATE 2018/05/09 (new Release v2.8.1) :
- refactoring
- use esri/geometry/projection (available since esri js api 3.24) instead of proj4js (external libs)
- systematic use of geometry engine (no more mercator utils, geometry server...)
- for polyline, the user can now add an arrow (available since esri js api 3.23)
- live measure while drawing
- WARNING : this release needs Esri API >= 3.24
(Direct zip link : https://github.com/magis-nc/esri-webappbuilder-widget-eDraw/releases/download/v2.8.1/eDraw.zip )
Demo : https://apps.magis.nc/demo/eDraw/
Github :
https://github.com/magis-nc/esri-webappbuilder-widget-eDraw
Wigdet's Features (improvments of standard Draw widget) :
- add name and description fields on drawings
- enable infowindow on drawings (selection)
- on text drawing, no insert if no name.
- on modification : enable geometry update (with snapping if wanted : CTRL) and preview symbology changes on the fly
- list
- add list of all drawings
- actions on each drawing : modify / delete / [up / down] / zoom
- all drawings : zoom, copy, delete, export
- on drawing infowindow -> select drawing in list
- on zoom on a drawing -> select drawing on map (and show infoWindow)
- re-order graphics with drag&drop
- import/export : allow users to export or import drawings (json format)
- import can be done with file drag&drop in import popup
- localStorage
- dynamic saving on each drawing add/delete/update
- on widget load : load drawings saved in local Storage
- draws plus (initially from Larry Stout https://geonet.esri.com/people/Larry_Stout)
- preview under mouse when adding text or point
- for text, add font choice, font angle, bold, italic, placement and underline options.
- add arrow menu for polyline
- checkbox to hide drawing's layer (and therefore widget UI)
- add of Nautical unit
- measure's for points/polylines/polygons with automatic update on element's update (or delete). Measure's can be indidualy disabled/enabled on any graphic.
- "On the fly" measure when drawing
- defaults symbols can be specified in config's file
- use of builtin projection engine (available since esri js api 3.24) instead of proj4js library
This message was updated by Jeremie Cornet (New Release)
GIS enthousiast, python & javascript lover
Solved! Go to Solution.
- Mark as New
- Bookmark
- Subscribe
- Mute
- Subscribe to RSS Feed
- Permalink
Anyone else haveing problems adding this widget, i have downloaded from the link as well as github but when i try to add widget to WAB icon not found and error message which is blank occurs, I have attached a previous screen shot in thread above. I have tried with Chrome and IE 10.
- Mark as New
- Bookmark
- Subscribe
- Mute
- Subscribe to RSS Feed
- Permalink
Hi George,
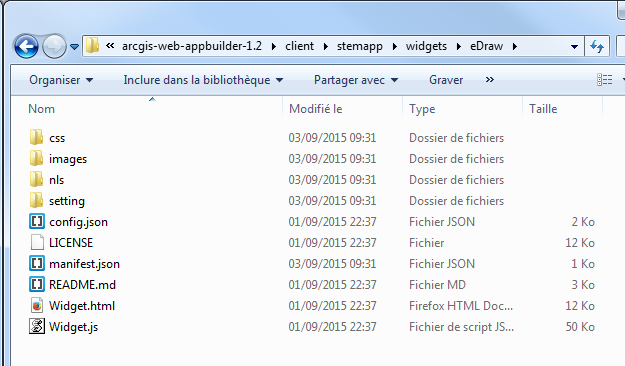
Is the eDraw folder in client\stemapp\widgets ?
GIS enthousiast, python & javascript lover
- Mark as New
- Bookmark
- Subscribe
- Mute
- Subscribe to RSS Feed
- Permalink
It is, however, when i download and extract to client stemap, I rename to edraw, is there another file that needs to be renamed?
- Mark as New
- Bookmark
- Subscribe
- Mute
- Subscribe to RSS Feed
- Permalink
I seem to be having the same problem as George.
- Mark as New
- Bookmark
- Subscribe
- Mute
- Subscribe to RSS Feed
- Permalink
Like Robert said, name it eDraw and also remove the existing draw widget from WAB.
- Mark as New
- Bookmark
- Subscribe
- Mute
- Subscribe to RSS Feed
- Permalink
Cheers George
- Mark as New
- Bookmark
- Subscribe
- Mute
- Subscribe to RSS Feed
- Permalink
George,
If you are not going to use the standard name of "eDraw" (see the capital D). Then you will have to change the name in the manifest json and the name property in the Widget.js.
- Mark as New
- Bookmark
- Subscribe
- Mute
- Subscribe to RSS Feed
- Permalink
Thanks Robert
- Mark as New
- Bookmark
- Subscribe
- Mute
- Subscribe to RSS Feed
- Permalink
Jeremie:
I have a few more questions for you.
1. Is it possible to create a text graphic that has multiple lines? Or will the user need to create individual pieces, then stack them to make it appear like it's one block with multiple lines?
2. Is there any chance in your next release you can have a label ahead of each area and distance measurement that say "area" or "length" or "perimeter?" I admit this would consume a lot more space but it might be a good addition if it's not too cumbersome. If you can do that, maybe it would be good to have them on separate lines if that is possible too?
3. This may have to do with the conversion factor but when I draw a line that should be ~1,320 ft in length the label shows ~4,290 ft. Is there something in the config that I need to adjust? My data is in State Plane.
4. Going along with #3, the total area of a ~40 acre tract is measuring ~440 acres.
5. Is it possible to copy and paste and existing graphic?
Beyond this, I really like the functionality and editing capability of your widget. Thanks for all of your work.