- Home
- :
- All Communities
- :
- Industries
- :
- Water Utilities
- :
- Water Utilities Questions
- :
- Using a District Meter Area (zone), calculating wa...
- Subscribe to RSS Feed
- Mark Topic as New
- Mark Topic as Read
- Float this Topic for Current User
- Bookmark
- Subscribe
- Mute
- Printer Friendly Page
Using a District Meter Area (zone), calculating water loss, and displaying results
- Mark as New
- Bookmark
- Subscribe
- Mute
- Subscribe to RSS Feed
- Permalink
- Report Inappropriate Content
I'm am trying to set up a map in AGOL with DMA (zones) so I can calculate the water loss in these areas and display it. Our basic setup is we have each of our meters GPS'd and that info is updated monthly to AGOL to reflect the new consumption in the attribute table. Our meters are symbolized with different colors to show which zone that particular meter resides in. Master/Zone meters are also color-coded to easily distinguish them from customer meters. I have also created a layer so I could draw polygons that represent each of the zones where we have our meters. I then use "Analysis" to run the aggregate tool, which totals the "consumption" field in the attribute table for each meter for each zone. It works great if you are only looking at zones that are independent of one another. But there are cases where we have one zone down stream from another. Therefore you have two master/zone meters to contend with in the summation of the "Consumption" field.
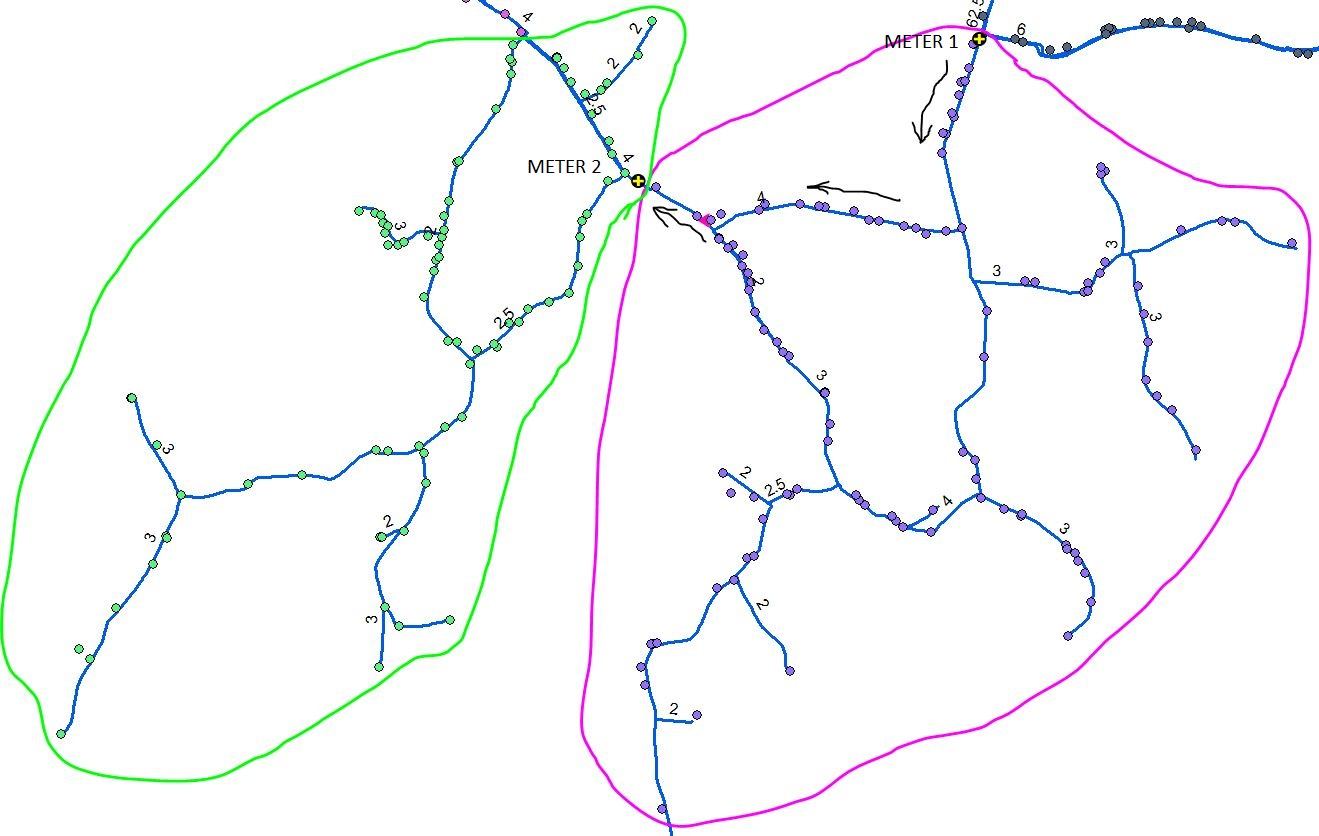
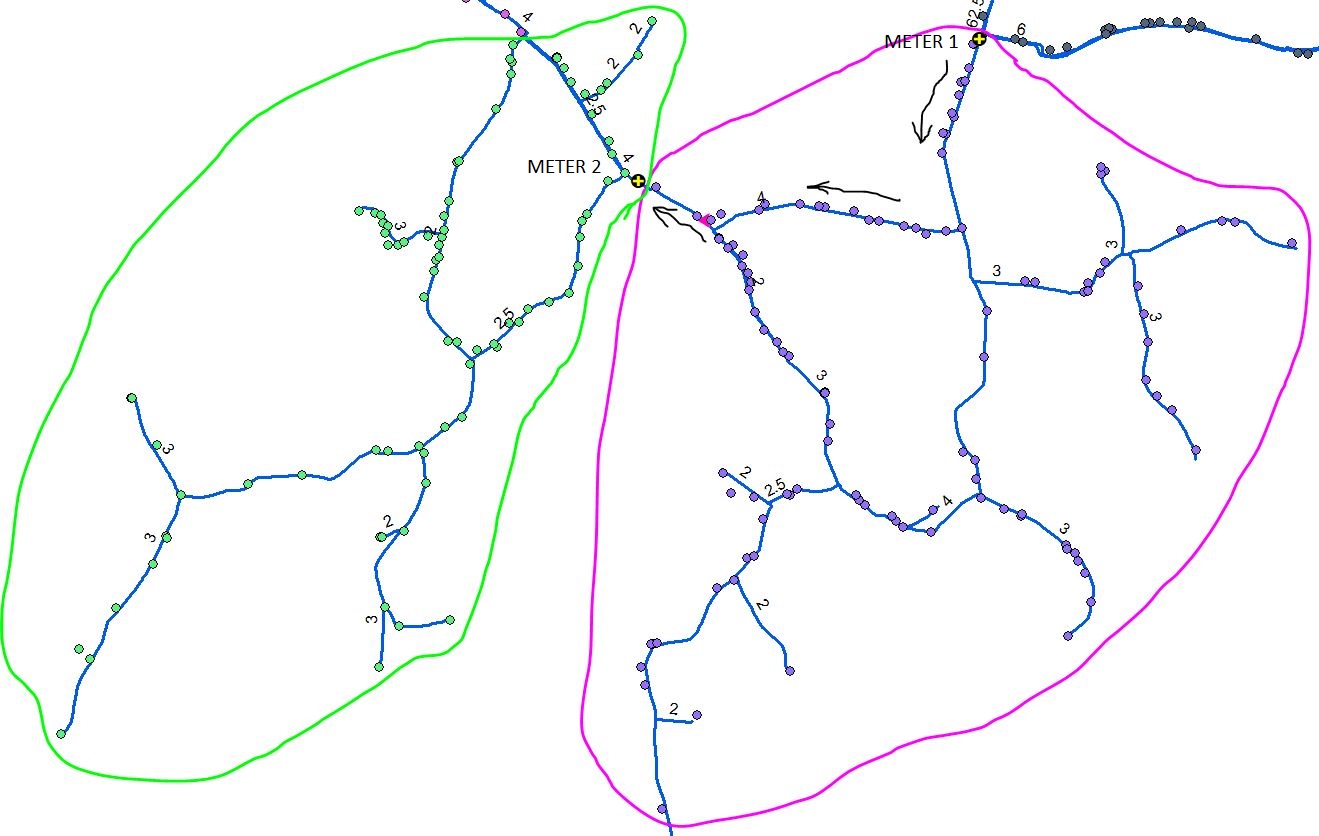
The following pic is kind of tough to see, but illustrates my issue. I have Zone 1 in magenta and Zone 2 in green. The master/zone meters are the meters with the yellow crosses where I denoted Meter 1 and Meter 2. If I wanted to calculate the water loss in Zone 2, that's fairly simple visually. Total the consumption of all the meters in Zone 2, subtract that from the Master/Zone Meter 2 and I have my loss. To use the aggregate tool I assigned the master/zone meter a negative value. That worked great if the zones are not connected in anyway. But now I'm trying to determine the water loss in Zone 1 (magenta), and I have the issue of two master/zone meters. The negative in the aggregate calculation will no longer work. I somehow have to subtract out Meter 2's consumption from Meter 1. I initially included Meter 2 in Meter 1's zone, but again, the negative now hurts me instead of helps. Does anyone have a suggestion or idea on how I can accomplish that?
Appreciate in help/advice.
Travis
- Mark as New
- Bookmark
- Subscribe
- Mute
- Subscribe to RSS Feed
- Permalink
- Report Inappropriate Content
Travis,
You are embarking on a subtly complex and fun numerical puzzle to solve. It may help to take into consideration the details on the variables at play in the water network when solving for an unknown, such water loss.
- Customer Meter data - Inspect the duration over which the metered flow is averaged. Volume through the meter divided by number of days / hours / minutes total. i.e. 200 gallons per day or 6000 gal/month does not translate to a reality of 8 gallons used at a constant rate every hour every day, but rather some peaking (see diurnal curve) has occurred during each unique day. To improve accuracy here, one would need instantaneous meter read at all meters to have a good handle on what was actually "metered" at a point in time.
- Master Meter data - same approach as above, instantaneous vs averaged, then knowing, since water is incompressible, do the measurement read clock times for the master meter line up with the customer meters? Also, during the master meter sample data period, were any unknowns of water demand occurring? Was the water department flushing any hydrants? Was the fire department fighting a fire? Was a contractor drawing water off to fill a tanker truck through a construction meter? Was there any city/town unmetered irrigation systems that were on at the time? (these could contribute to the overall water loss inadvertently)
- Deciphering Types of Water Loss sources - water loss or unmetered unknown water can be a result of several factors: meter inaccuracy (+/-5% depending on meters, each meter may be at a different age or accuracy, traditional leaks through pipe cracks, illegal taps, leak past a valve that is not fully seated, very low continuous flow through a meter (aka small toilet leak). AWWA M36 WATER AUDITS AND LOSS CONTROL PROGRAMS, FOURTH EDITION is a great reference on water loss.
- Leak Behavior - a leak through a pipe crack, is at its basic behavior, just water exiting an orifice which thankfully has a defined equation (search fluid exit orifice loss equation). To solve for the flow leaving an orifice, one needs pressure (which varies based on where and when in the network) as well as size and type of the orifice itself. So you can see there may need to be some assumptions made based on pressure at each point in the network and size of leak to measure what the water loss is (assuming other inaccuracies such as meter accuracy and interconnects with the system have been taken out of the picture). Sum this up by the thought that as pressure increases, water loss flowrate increases to a threshold where the orifice becomes a bottleneck.
- Leak Location & Quantify - if the instantaneous delta between master meter and all customer meters was known, and making an assumption that the difference is only related to water loss through one or more cracks in a pipe (not other reasons), the number of leaks and location of leaks would remain unknown without further investigation (sonic devices etc fun toys see in action!)
- Interconnections - unmetered interconnections in the network such tees or open valves between metered areas create a path where unmetered water can flow in or out of that network, rendering all of the effort to focus on improving accuracy of any of the above variables for not
With all of these variables at play it, it can end up being a complex task to calculate by hand. I have seen many water utilities gain understanding of their water loss by investing time in a well calibrated hydraulic model. Ideally arriving a a model that, run over an extended period of time, closely matches real word conditions. At that point, some of today's hydraulic modeling software's, given enough known variables can solve for plausible and potential leak regions. Keep in mind even hydraulic model results can have many unique plausible scenarios that could mathematically match observed pressure and flow rate (ie. is it 2 large leaks or 6 smaller leaks near by).
Typically I have seen water utilities most effective when they tackle water loss through a combination of approaches:
- Proactive valve operation programs (to improve resiliency when leaks occur and minimize downtime/water loss)
- Proactive water loss education programs with the public (spot a leak -> report a leak)
- Meter replacement programs (to improve accuracy on the customer delivery points themselves)
- Using a well calibrated hydraulic model to reliably predict system behavior and identify areas to investigate
Esri has many well defined solution to support field operations, so I encourage you to check out the GIS for Water Utilities page and scroll down to the Business Solutions section and check it out.
Talk again soon!
Martin
- Mark as New
- Bookmark
- Subscribe
- Mute
- Subscribe to RSS Feed
- Permalink
- Report Inappropriate Content
Martin,
I appreciate the reply. I'm very familiar with the items that you outlined above. My question is more about using the tools in "Analysis" to achieve my goal. In my case, water loss is not an unknown; I know what went through the master meter, and what we sold through each customer's meter within the zone. I'm looking for an easy way to leverage AGOL to display water loss as a percentage in each zone. To achieve that, I need to make the calculation I described above. I'm trying to make this process as simple as possible so people within my office can simply "update" the "consumption" layer using a .csv file and then run the analysis. That map or information, generally shown as a percentage, would be displayed on digital sign (large LCD TV) within our office to bring attention to areas with high levels of loss.
Travis
- Mark as New
- Bookmark
- Subscribe
- Mute
- Subscribe to RSS Feed
- Permalink
- Report Inappropriate Content
Hi Travis! Cool project - I like the idea to have the DMA water loss dashboard displayed on a TV in your office.
You mentioned that you "assigned the master/zone meter a negative value". I'm not sure if you are doing this manually when you input the new data each month, or if you are using some sort of expression for your calculations. It sounds like what you want to do would be possible using Arcade expressions to calculate new fields in your feature layer. Then you could treat Meter 2's value as either a positive or a negative depending on the DMA you are calculating.
If you are not familiar with calculating new feature service fields using Arcade, see this blog post: Create Custom Field Calculations Using Arcade Expressions
When your co-workers upload the new .csv consumption values, you could just have them create a new field(s) for the month and run your saved Arcade expressions to calculate the fields before they run the analysis.
PS: If your data is local, for instance in ArcGIS Enterprise, you could probably create a custom Python tool to run all of these calculations locally, and just have your federated feature service published to the DMA Dashboard to display the results. That may be simpler for your co-workers to follow - all the steps being contained in a single custom tool.
- Mark as New
- Bookmark
- Subscribe
- Mute
- Subscribe to RSS Feed
- Permalink
- Report Inappropriate Content
Thanks for the input Joe, I really appreciate it. I've been trying to get this done for a while now, and as new tools and functionality evolve with AGOL, the closer I get. I'm sure someone way more savvy then myself could easily have done this years ago, but I want to try learn more about it and see where it goes. I don't have a lot of time to devote towards it at work, but I think AGOL is pretty amazing at what it can do.
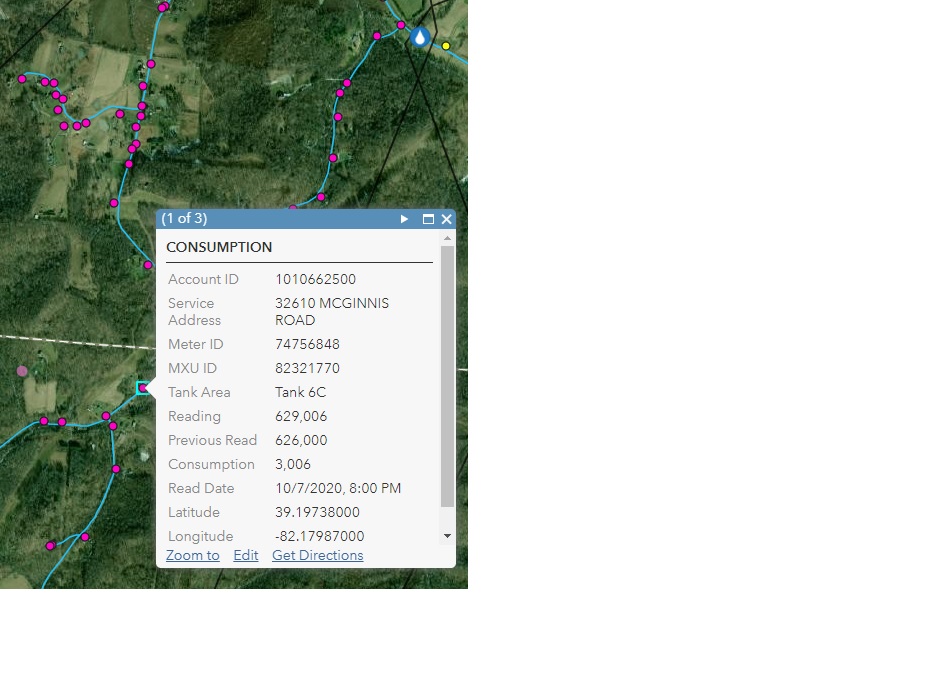
Yes, I was assigning that value manually. It was just an easy way for me to add all the values contained within a polygon region and have if give me the answer I wanted using the Aggregate tool. I have never dabbled with "expressions", but I think this is where I'm heading. I think you are right, Arcade might be where I need to go to make this work. I've been reading and messing around with it today trying to figure out how to make things work. I have one layer called "Consumption" that contains all 7000 meters for our district including the master/zone meters. The actual field that groups them is "Tank_Area" and is the zone where each meter resides (actual attribute table is below). The master meter also has a unique name in the same Tank_Area field. I guess I'm looking to develop an expression that says within this layer called "Consumption", total the values in the field name "consumption" for all the meters that have the name "Tank 6C" and subtract that from the master meter called "Tank 6C Master". I'm not sure how to put that into an expression. Does that make sense? I then have to do that somehow for 15 zones or so. I went into my Consumption layer and I see where to add an expression to the pop-up, but I'm not sure what to type in there, and after I type it in there, where does the returned value go. I have some learning to do! (I tried pasting in an image but it peeled it out. I attached it below. Hopefully that worked. I don't know if my original post had the images stay or not. I suspect not which makes it hard to follow. I'll attach my other image to this one as well. The Zone.jpg is the attribute screen shot referenced in the last post)
- Mark as New
- Bookmark
- Subscribe
- Mute
- Subscribe to RSS Feed
- Permalink
- Report Inappropriate Content
Joe,
Quick question. I was reviewing that link you posted (Create Custom Field Calculations Using Arcade Expressions ) and was experimenting in my layers. Is it possible to create a field in Layer A, and populate that field using "Calculate" and Arcade to write an expression that pulls data from a field in Layer B?
Thanks again,
Travis
- Mark as New
- Bookmark
- Subscribe
- Mute
- Subscribe to RSS Feed
- Permalink
- Report Inappropriate Content
Sounds like you want to do a “join”? You will likely have to use the “analysis” tool to either spatially join the layers, or relate/join them based on a common ID field. Once layers have been related/joined, you should be able to use Arcade (or maybe SQL) to fetch the value from one layer to the other. I forget the exact syntax right now, but yes, this is possible.
I know this is a very top-level response – there are a lot of options doing these sorts of calculations. Google around, looking at ESRI technical resources and Stack Exchange/Overflow as well as GeoNet posts.
Joe Bryant
GIS Coordinator
We’re hiring! Visit our career site, here<https://recruiting2.ultipro.com/WES1042WYAI/JobBoard/204a74b2-b15f-43fd-a0ba-448892f98e9a/?q=&o=postedDateDesc&w=&wc=&we=&wpst=>
WEST YOST
direct 530.761.0226
Currently working from home. Please use mobile: (916) 833-5840