Turn on suggestions
Auto-suggest helps you quickly narrow down your search results by suggesting possible matches as you type.
Cancel
- Home
- :
- About MelindaMorang
MelindaMorang
Esri Regular Contributor
since
07-04-2014


a week ago
1250
Posts created
10
Kudos given
209
Solutions
499
Kudos received
Turn on suggestions
Auto-suggest helps you quickly narrow down your search results by suggesting possible matches as you type.
My Ideas
(0 Idea Submissions)Latest Contributions by MelindaMorang
|
POST
|
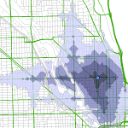
Service Area in ArcGIS Pro uses a different polygon generation algorithm than ArcMap, so the results are not expected to look identical. The new polygon generation algorithm creates service areas that look more "bubbly" or more like clean buffers around streets, and it avoids the strange spikes you would occasionally see in ArcMap.
... View more
05-08-2020
11:58 AM
|
4
|
0
|
4154
|
|
POST
|
Yes, sorry about that. We have not yet fully completed the user interface implementation for the evaluator dialogs, so the experience right now is pretty terrible. If you just want to use a simple field (no complex calculations), just enter the field name in the Result box. If the Language is VBScript, put square brackets around the field name: [Time_Min]. If the Language is Python, put exclamation points around the field name: !TIme_Min!
... View more
05-07-2020
08:26 AM
|
5
|
4
|
3622
|
|
POST
|
I'm sorry to hear you've been experiencing problems with network datasets in SDE. This workflow is supported. If you can describe in detail the problems you're experiencing or call Esri's Technical Support to report them, we can get them fixed.
... View more
05-06-2020
07:52 AM
|
0
|
3
|
1627
|
|
POST
|
The short answer is that this entirely depends on how you have configured the network dataset. I will attempt a longer answer so you can hopefully get this figured out. A network dataset is configured with cost (also called impedance) attributes that determine the cost (like distance or time) to traverse each road or intersection. From your question, I presume your network has at least one cost attribute that calculates distance in units of kilometers and another that calculates drive time with units of minutes. Whoever created the data presumably set those up, or else you used ArcMap's network dataset creation wizard, and it configured them for you automatically. Each cost attribute in a network dataset must be configured so it knows how to calculate the cost for each edge or junction in the network, and it does this using something called evaluators. There are many different types of evaluators, and each of them calculates cost in a different way. The simplest ones just use a constant (every road just uses a fixed value) or a field (just read the cost from a field in the source data). There are other more complicated ones that allow you to use python or VBScript or draw information from traffic or public transit tables. So, what you need to do is to look at the evaluators for your cost attribute to see how they are currently calculated. This will tell you if/how you need to update the fields for your new data. My guess is that the network is using a field evaluator and drawing information from the shape length of the streets, but that might not be the case. Here is some documentation to help you understand network attributes generally and cost attributes specifically: ArcGIS Pro: Network attributes—ArcGIS Pro | Documentation Cost attributes—ArcGIS Pro | Documentation ArcMap: Understanding network attributes—Help | Documentation
... View more
05-05-2020
08:35 AM
|
0
|
0
|
3032
|
|
POST
|
Hello Christian. Unfortunately, no, not yet. BetterBusBuffers is a much older tool, and I have not yet created a version that works with the much newer officially-supported public transit data model in ArcGIS Pro. It's been on my to-do list for a while, though, and your request bumps it up in priority slightly. You can follow along with the status of this item here: Make BetterBusBuffers work with the Network Analyst public transit data model · Issue #137 · Esri/public-transit-tools ·… So I can better understand your needs and plan my strategy, could you answer a few questions for me? What analysis questions are you hoping to answer witih BetterBusBuffers? The BetterBusBuffers toolbox contains several tools. All of them calculate some aspect of transit frequency, but each does something slightly different. Which of the BetterBusBuffers tools are you interested in using? (See the list here: BetterBusBuffers | GTFS in ArcGIS ).
... View more
04-28-2020
08:04 AM
|
2
|
1
|
2450
|
|
POST
|
I cannot reproduce this problem, but I have an idea about what caused it. Do you also have the BetterBusBuffers tool on your computer, and where is it saved in relation to the Transit Network Analysis Tools toolbox? Both of these are python toolboxes, and both of them import a script called ToolValidator, and both versions of ToolValidator have a method called allow_YYYYMMDD_day(). From the error message, it looks to me as if Transit Network Analysis Tools is mistakenly calling the BetterBusBuffers version of that method. I don't know how it would do that unless you saved the two tools in the same folder or something. Try a fresh download of each toolbox, and make sure that they're saved in different folders.
... View more
04-27-2020
08:15 AM
|
0
|
0
|
3951
|
|
POST
|
Esta usted usando la herramienta "Add GTFS to a Network Dataset"? Con esta herramienta, el primer calculo seria mas despacio porque el red necesita cache los datos del gtfs. Si su gtfs es muy grande, tomara unos minutos. Los siguientes calculos deberia ser mas rapido porque el calculo simplemente use el cache. Si no, hay otras posibilidades. Lo siento, no se como explicar en espanol. En ingles: - If there is no viable path through the network to reach a demand point, the Location-Allocation solver may search the entire network dataset attempting to find a path. If the network is large (like a whole country), this could take a long time. - If your street data does not have spatial index, everything will be slow. - ArcMap might be running out of memory. Ahora, Add GTFS to a Network Dataset es muy viejo. Si es posible, use las herramientas nuevas en ArcGIS Pro para crear la red y hacer el calculo. Los calculos de gtfs en ArcGIS Pro son mas rapido y ArcGIS Pro tiene mas memoria.
... View more
04-16-2020
01:45 PM
|
0
|
0
|
802
|
|
POST
|
Just select the Stop or Route you want to delete, and hit the Delete button on the Edit tab.
... View more
04-16-2020
08:00 AM
|
6
|
1
|
2132
|
|
POST
|
You have to format it as a space-separated string. So, if you want [2, 3, 4], you have to populate the Breaks_[Cost] field with "2 3 4". For the sake of an example, if you wanted [1.5, 4.5, and 10.2], you would write "1.5 4.5 10.2".
... View more
04-15-2020
02:02 PM
|
0
|
0
|
1808
|
|
POST
|
Yes, this is by design. In ArcGIS Pro, you can use the standard editing tools available on the Edit tab to create and modify Network Analyst inputs.
... View more
04-15-2020
01:43 PM
|
6
|
3
|
2132
|
|
POST
|
If you are actually trying to create a network dataset that more realistically models public transit and walking, this is a better tutorial for you: Create and use a network dataset with public transit data—ArcGIS Pro | Documentation That requires ArcGIS Pro and GTFS data, however.
... View more
04-14-2020
03:31 PM
|
0
|
0
|
2212
|
|
POST
|
Unfortunately, this is difficult in ArcGIS Pro as we have not yet implemented (as of Pro 2.5) the Network Identify tool that was available in ArcMap. Honestly, the easiest way to check this right now is to open the network dataset in ArcMap and use Network Identify to click on the new street and check its attributes. Network Identify should tell you the value of the street for each impedance and restriction attribute. It should also provide you with a list of other edges and junctions to which it is connected (so you can verify connectivity).
... View more
04-14-2020
08:13 AM
|
0
|
1
|
1481
|
|
POST
|
There are a lot of potential reasons for this. I'll list some and see if that gets you on the right track: 1) The endpoint of the new line doesn't physically connect to the existing network edges. (You need to turn on snapping when you're editing.) 2) The new segment does physically connect to the existing segments, but it doesn't connect at an existing endpoint (for End Point connectivity) or an existing vertex (for Any Vertex connectivity). This is unlikely, as Pro's editing tools automatically handle this situation if you're editing a feature class that participates in a network dataset. 3) The elevation fields of the new line don't correspond properly to the elevation fields of the existing lines. Again, this is unlikely, as Pro's editing tools automatically handle this situation if you're editing a feature class that participates in a network dataset. 4) The attributes of the new line are not configured correctly, so the new line shows up as restricted. The Stops get located on the closest non-restricted network edge instead. 5) When you ran the Build Network tool, you got a build error related to the new line. You need to check the build error output text file to see what the error was, and fix it.
... View more
04-13-2020
01:21 PM
|
0
|
3
|
1481
|
|
POST
|
Hello Christian. Yes, you have to create separate LineVariantElement features for the opposite direction of travel. The Public Transit evaluator only calculates travel times in the direction of digitization of the lines in order to prevent accidental backwards travel. You will need to draw a separate line from Stop 25 to Stop 1 and add all the associated entries in other tables to go with it.
... View more
04-07-2020
08:13 AM
|
2
|
1
|
1724
|
My kudoed posts
| Title | Kudos | Posted |
|---|---|---|
| 1 | a week ago | |
| 1 | 2 weeks ago | |
| 1 | 2 weeks ago | |
| 1 | 06-12-2026 01:53 PM | |
| 1 | 04-21-2026 08:39 AM |
Activity Feed
- Got a Kudo for Re: TransitNetwork for multimodal analysis?. Tuesday
- Posted Re: TransitNetwork for multimodal analysis? on Public Transit Questions. a week ago
- Got a Kudo for Re: Network analyst public transit tool Prepare time lapse polygons generate polygons along LineVariantElements rather than around stops. a week ago
- Got a Kudo for Re: Network analyst public transit tool Prepare time lapse polygons generate polygons along LineVariantElements rather than around stops. a week ago
- Posted Re: Network analyst public transit tool Prepare time lapse polygons generate polygons along LineVariantElements rather than around stops on Public Transit Questions. 2 weeks ago
- Posted Re: Network analyst public transit tool Prepare time lapse polygons generate polygons along LineVariantElements rather than around stops on ArcGIS Pro Questions. 2 weeks ago
- Got a Kudo for Re: How do I fill in the blank areas where streets are far apart?. 06-12-2026 03:13 PM
- Posted Re: How do I fill in the blank areas where streets are far apart? on ArcGIS Network Analyst Questions. 06-12-2026 01:53 PM
- Got a Kudo for Re: Adding Network Dataset to AGOL. 06-08-2026 08:19 AM
- Posted Re: Creating a maximum walkshed around each point on ArcGIS Network Analyst Questions. 05-29-2026 11:37 AM
- Posted Re: Combine steps involving stairs and turns - Status changed to: Under Consideration on ArcGIS Network Analyst Ideas. 05-18-2026 01:43 PM
- Posted Re: Choose output location when creating network analysis solvers - Status changed to: Implemented on ArcGIS Pro Ideas. 05-15-2026 03:07 PM
- Posted Re: Route Solver - Add Locations - Convert Model Builder to Python script on ArcGIS Network Analyst Questions. 04-21-2026 09:21 AM
- Got a Kudo for Re: Route Solver - Add Locations - Convert Model Builder to Python script. 04-21-2026 08:42 AM
- Posted Re: Route Solver - Add Locations - Convert Model Builder to Python script on ArcGIS Network Analyst Questions. 04-21-2026 08:39 AM
- Got a Kudo for Re: Route Solver - Add Locations - Convert Model Builder to Python script. 04-15-2026 03:26 PM
- Posted Re: Route Solver - Add Locations - Convert Model Builder to Python script on ArcGIS Network Analyst Questions. 04-15-2026 02:24 PM
- Posted Re: Network Analyst Public Transit Trip Planning on Public Transit Questions. 04-13-2026 12:59 PM
- Posted Re: Census roads to build network dataset on ArcGIS Network Analyst Questions. 03-27-2026 06:37 AM
- Got a Kudo for Re: Recover Network Dataset from Mobile Map Package. 03-25-2026 05:52 AM
Contact Me
| Online Status |
Offline
|
| Date Last Visited |
a week ago
|