- Home
- :
- All Communities
- :
- User Groups
- :
- Story Maps for Education
- :
- Blog
- :
- Speaking the “Language” of Spatial Analysis and Sc...
Speaking the “Language” of Spatial Analysis and Science via Story Maps
- Subscribe to RSS Feed
- Mark as New
- Mark as Read
- Bookmark
- Subscribe
- Printer Friendly Page
Last update: December 16, 2021
Spatial analysis has always been a hallmark of GIS, the “numerical recipes” which set GIS apart from other forms of computerized visualization and information management. With GIS we can pose questions and derive results using a wide array of analytical tools to help us understand and compare places, determine how places are related, find the best locations and paths, detect and quantify patterns, and even to make spatial predictions.
"The greatest potential for change and success occurs when we all understand and speak the same language—-the language of spatial analysis." -- Chris Cappelli
What better way to speak that language than via a story map, in either "modern" ArcGIS StoryMap or "classic" mode? As people continue to explore and share their world using this medium, some are venturing beyond the simple map tour mode of points linked to photographs, toward “stories” that examine, explore, and showcase the results of a spatial analysis. We’ll likely see more of these analytical stories as the story map medium is introduced into more GIS courses, particularly at the university level.
As you explore the story of spatial analysis, please KEEP SCROLLING DOWN for a small catalog of analytical story maps. Be sure to visit again as I will try to add to this page throughout the year!
Hot! This story map is about ArcGIS Hub, a new technology currently in worldwide adoption, for creating and publishing open data in an easy and accessible way. See this gallery of Science Hubs, many of which include story maps.
Scientists as Storytellers, from Esri's Charmel Menzel of our National Government Sciences Team, as presented at the 2018 American Geophysical Union (AGU) Fall Meeting.
Esri's Applied Analysis and National Government Sciences Teams' Scientists Communicating with Story Maps Gallery.
A story map with both ANALYTICS and suggested societal SOLUTIONS: Take Action: Tools to Understand and Prepare for Extreme Heat.
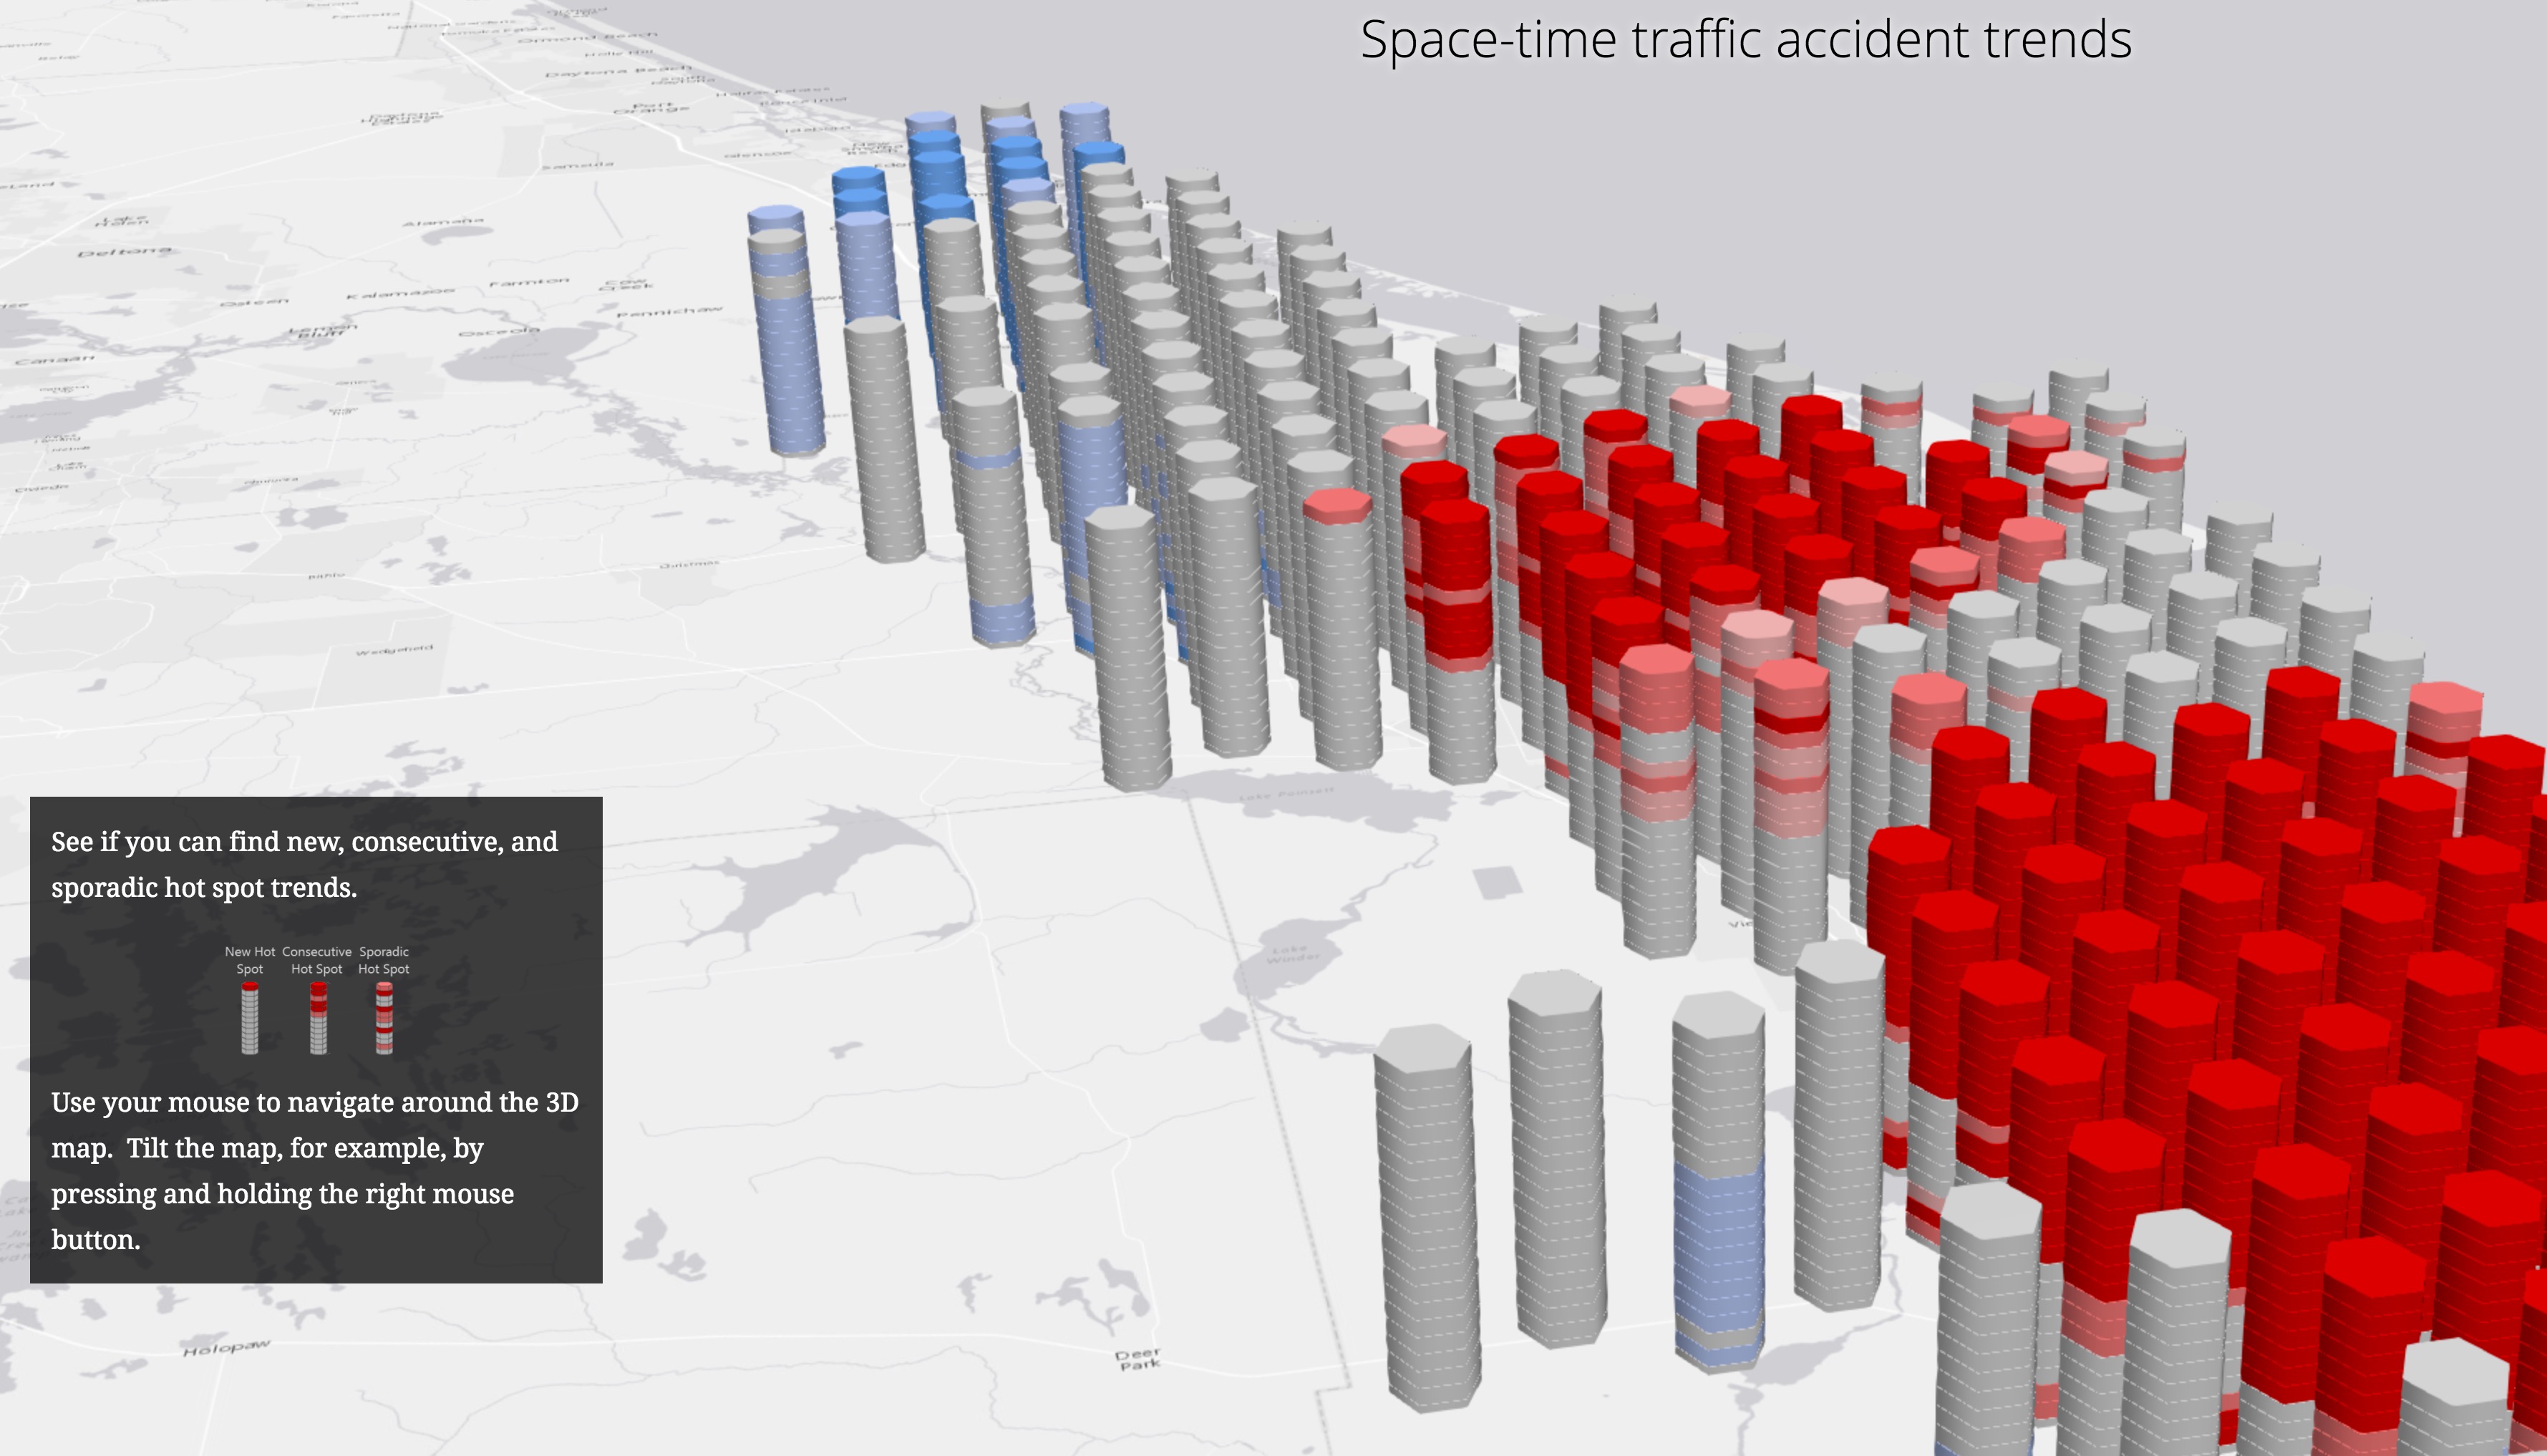
Esri's Lauren Scott Griffin's "Analyzing Traffic Accidents in Space and Time" uses the classic Story Map Cascade to analyze automobile crash data in Brevard County, Florida using ArcGIS Pro. The study addresses important questions such as where are traffic accidents increasing (including as specific hot spots within a road network), and when are the most dangerous times to be driving. You can also download the data, follow the complete ArcGIS Pro workflows, and access additional resources on ArcGIS .
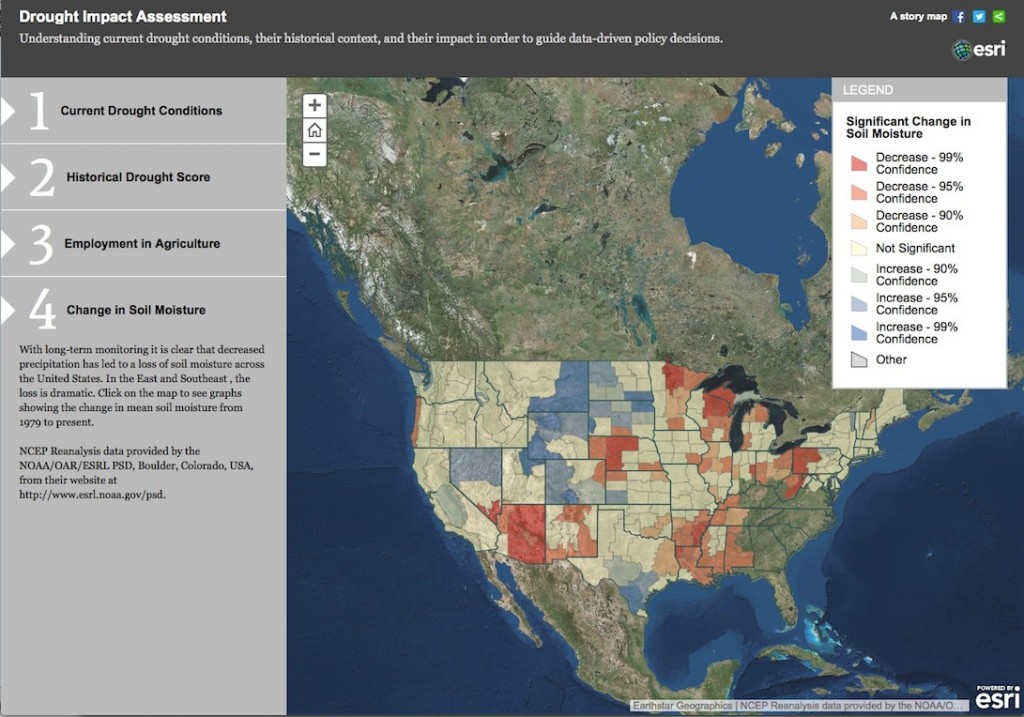
Esri's Lauren Bennett’s “Drought Impact Assessment” uses the classic Story Map Series - Side Accordion Layout to guide the viewer through four stages of an analysis, culminating in a map of statistically significant decreases in soil moisture over a 35-year period, as part of longer term monitoring effort. See the demo of the story map at the 2014 Federal GIS conference (minute 2:14). In addition, this video at minute 6:28 is an example of using Python to schedule a task that can grab data from the United States Drought Monitor and recreate it as a live service that might be inserted into a story map.
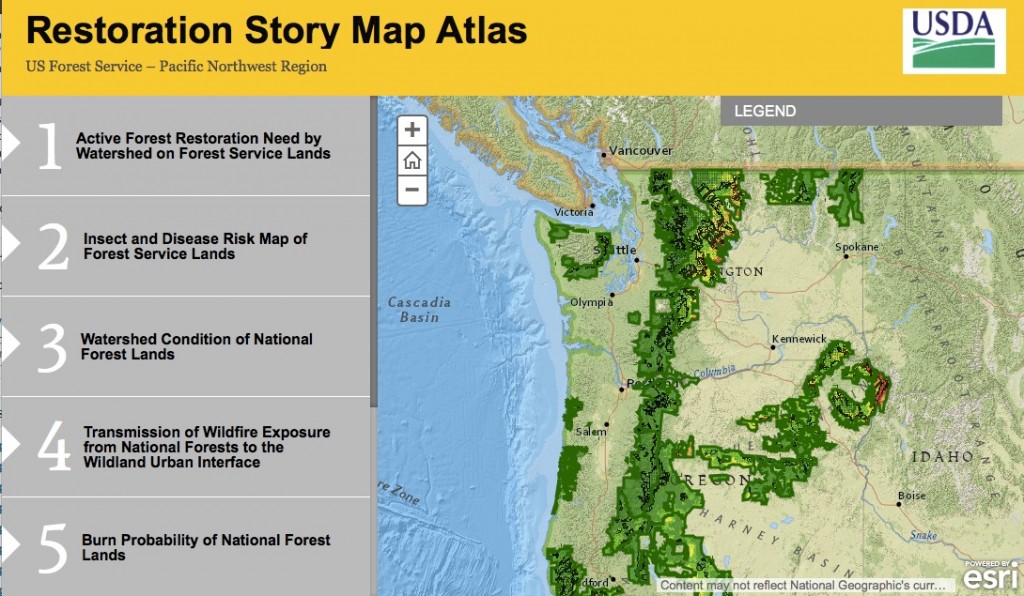
The USDA Forest Service’s Restoration Story Map Atlas uses the same format to show the results of analyses for the Pacific Northwest ranging from identifying the percentage of a watershed that could be effectively treated through active forest thinning, prescribed fire, or use of wildfire, to the results of a bivariate rendering of burn probability by conditional flame length.
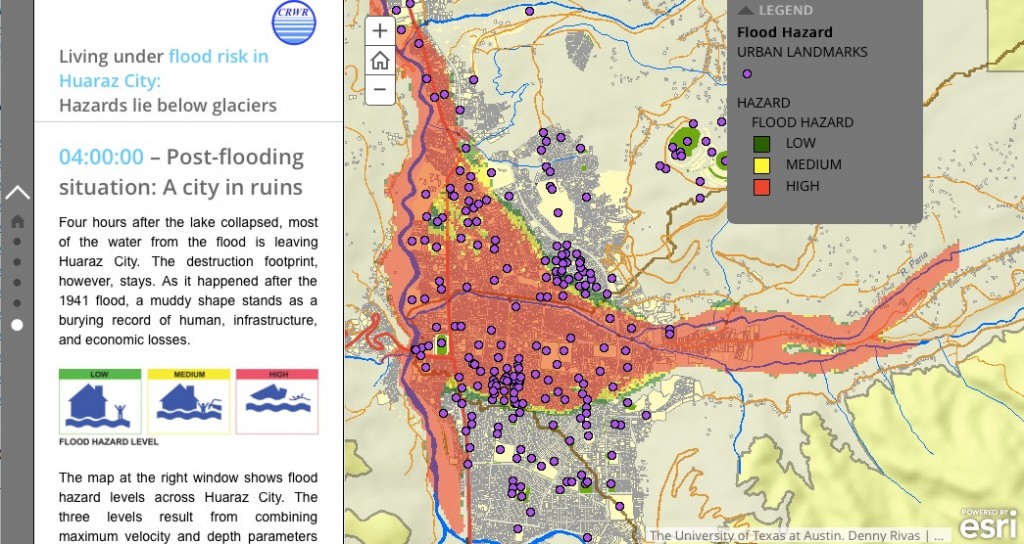
The Center for Research in Water Resources at the University of Texas at Austin uses the classic Map Journal app to tell the story of flood risk in and around Huarez City, Peru as based upon hydrodynamic modeling results. See the related blog post about this research.
Other great analytical examples include:
- New! This draft of the USDA Forest Service's Minnesota 2018: Forest Features technical report is full of analytics on the state's forest area, type distribution, age, volume and species composition, and much more.
- New! Trace the Source of Ocean Trash was presented by a University of Redlands graduate student at the 2021 Esri Ocean, Weather, and Climate GIS Forum as a Lightning Talk.
- Empirical Bayesian Kriging (EBK) Regression Prediction Tool Assessment for Climate by researchers at NCAR. This story map summarizes the workflow to format PRISM 20-year climatological data for analysis in the ArcGIS EBK regression tool, and for comparison to the original PRISM data.
- DTN Precipitation Analytics and Product Demo, a hydrologic modeling calibration and validation case study of the May 18-19, 2020 Michigan floods and dam failures by meteorologists at DTN.
- The DUNEX pilot experiment off North Carolina's coast looks at the evolution of sandy shorelines battered by storms.
- (1) How do bends form in peat-land streams?; (2) How to take public perceptions into account?; and (3) How do side channels develop? is a series of analytical story maps featured in the open-access journal article Arevalo et al. (2020), Storylines for practice: A visual storytelling approach to strengthen the science-practice interface, Sustainability Science, doi: 10.1007/s11625-020-00793-y.
- Data Science and Analytics. Mapped. is a fascinating journey into the "spatialization" of concepts, presenting the first comprehensive knowledge reference system, basemap, and exploration platform for terms and concepts in the spatial data science domain. What are the concepts that you should be learning and implementing to become a specialist in data spatial data science?
- Analytical story maps by undergraduates in the winter 2019 course at University of Southern California (USC), SSCI 381: Statistics for Spatial Sciences, taught by Esri's Orhun Aydin:
- Land Use Mapping in Queensland, presents an overview of how the Queensland Australia Government maps and monitors land use, including by way of machine learning algorithms to automate image analysis, classification and mapping of land use features from satellite imagery.
- Ocean Color: Chlorophyll-a in our Oceans, presents a detailed workflow, including videos, that is the centerpiece of Esri's current partnership with the Group on Earth Observations (GEO) BluePlanet initiative in support of SDG 14.1.1’s eutrophication methodology for summarizing chlorophyll-a over time in 4 pilot areas worldwide.
- Great Barrier Reef Catchment Loads Monitoring Program: 2016-2017 and 2017-2018 tell the story of this ongoing large-scale monitoring program that tracks and analyzes long-term trends in water quality entering the Great Barrier Reef lagoon from adjacent catchments along the east coast of Queensland, Australia. The monitoring data are used to validate catchment water quality models toward Reef 2050 Water Quality Improvement Plan targets.
- Geological & GIS Mission for ThamLuang Cave, presents an overview of how GIS was applied by Esri Thailand for the Thailand Cave Rescue of the youth soccer team, including details of discrepancy analysis, hydrologic analysis (ArcHydro), and aspect analysis. It is an amazing story!
- Serengeti Squeeze, based on a wildlife conservation study published in Science about how increased human activity around the Serengeti-Mara ecosystem, one of Africa's most iconic ecosystems, is "squeezing" the wildlife in its core," damaging habitat, and disrupting the migration routes of wildebeest, zebra, and gazelle.
- Hold Tight Little Lizards!, based on a study published in Nature about how hurricanes may be agents of natural selection for a species of small brown lizard endemic to the Turks and Caicos islands in the Caribbean.
- How to make effective analytical use of The Climate Explorer within the US Climate Resilience Toolkit (map future climate projections and gain better understanding of the Fourth National Climate Assessment or NCA4, in the process).
- Story maps as scientific project/research portfolios: researcher Alexandra Rao and student Amanda Huber!
- A crowd-sourced story map that asks Higher Education Research Active Collaborations 2018 of Esri Canada.
- A crowd-sourced story map that asks What Questions Have You Answered by Mapping and Spatial Analysis in GIS?, by Esri Canada.
- Water Wells Site Selection in East Africa using GIS, by Claudia Cáceres & Sarah Osailan of Claremont Graduate University.
- Deep Learning for Detection, Identification, and Mapping of Cassava Diseases, a Microsoft AI4E Azure Grant project by Kimani Mbugua, PhD student at Claremont Graduate University.
- Enabling Apps for Green Infrastructure Planning by Esri's Ryan Perkl, describes the main components of green infrastructure networks and the planning process, gives an overview of Esri's Green Infrastructure Initiative, and reviews the data, analytical models, and apps needed to be successful in determining what to preserve and where, and which areas need restoration or reconnection.
- A related story map provides Solutions for 3D Basemap and Development Review for urban and regional planning. See also the 3D Scene Layer Group in ArcGIS .
- The Great Lakes Coastal Wetland Restoration Assessment of the USGS and the New College of Florida (Justin Saarinen).
- The Emerging Hot Spots of Forest Loss of the World Resources Institute's Global Forest Watch is based in part on their journal article in Environmental Research Letters.
- University of Oxford’s Global Poverty Map Journal explaining the Multidimensional Poverty Index.
- Endangered Reefs, Threatened People, showing the results of GIS vulnerability analyses at varying scales.
- As part of MarineCadastre.gov, NOAA and BOEM have produced Exploring Ocean Wind Energy (which includes a link to download the data used in the analysis), Evaluating Shipwreck Density by Lease Block, and Exploring Vessel Traffic in Jacksonville, Florida.
- Wildfires in Oregon is a nice mix of science and policy.
- Updated! Mapping the Stories of Californians... was created by students at Stanford University in the course BIO 128: Geographic Impacts of Climate Change: Mapping the Stories. It is based on interviews, surveys, and five climate change impacts targeted by a global Scientific Consensus Statement. See their new version for the entire US
- Sea Level Rise Inundation for the State of Delaware (see related blog post), and a story map employing a similar analysis for Dorchester County, Maryland.
- Feeding the World: Can Global Crop Production Meet Future Demands?
- Ocean Acidification, with calculations of future scenarios of ocean aragonite saturation, “swiping” between 1885 and 2095.
- Spatial analysis steps in siting a new distributed solar generation facility by Environmental Resources Management (ERM)
- "We Baby Turin" or "Wellbeing for the Baby Turin," drawing inspiration from the Save the Children's Atlas of Children at Risk, includes spatial analyses of proximities to children's services in Turin (Torino), Italy (available in both Italian and English).
- A series of spatial analytical results for "connecting clients, services, and locations" by the Data Analysis for the Gilchrist Center.
- Point and route density analyses of retail sales data are featured in Ontario Mills - Brand Alliances.
- Modern version of Florence Nightingale's coxcombs (mapping of multivariate data), showing the mortality of British Soldiers in the Crimean War. See related blog post.
- Results of spatiotemporal analyses of invasions of non-native aquatic mussels in the US and variations in wildlife strikes on civilian aircraft in the US.
- Updated! Results of Storm Surge Inundation (SLOSH Maximum of Maximums) Modeling.
- The second to the last panel of this Harbor Seal Survey Map and Methods story map uses a Shiny app to allow the user to interactively model Oregon harbor seal population dynamics with a simple numerical model.
- The informative Motion of Tectonic Plates story map includes relative and absolute plate motion vectors, seismic strain graphs, and measurements of coseismic horizontal crustal displacement.
- Modeling Flash Flood Events in Ungaged Semi-Arid Basins using the KINematic runoff and EROsion Real-...
- How To Use Land Cover Data as a Water Quality Indicator
- The mission and analytical stories of UNC-Asheville's National Environmental Modeling and Analysis Center (NEMAC)
- Esri's Witold Fraczek and Lenny Kneller explain and analyze the poles of inaccessibility and their locations in Antarctica, Eurasia, North America, South America, Africa, Australia, and the Arctic Ocean. See also the related blog post.
- Updated! Predicting Cetacean Density with Geospatial Models explains the process behind collecting marine mammal survey data and the methodology used to create habitat density distribution models.
- How has the Columbia Glacier (in Alaska) Changed?, which includes an interactive application that calculates the volume of water that has melted from that glacier between 2009 and 2013.
the glacier volume web app itself decoupled from the story map - Terrain Tools Tour (by Esri's Ken Field et al.)
- This Internet of Things (IoT) story map highlights various analytical uses cases for different industries or user communities. It will continue to be updated with additional demos and use cases.
- Bittersweet Chocolate: The Climate Change Impacts on Cocoa Production in Ghana includes some spatial modeling results, while also pointing the viewer to a few peer-reviewed scientific studies for further in-depth information.
- How Certain are Land Use Change Projections? is an overview of the PhD thesis of Judith Verstegen of the University of Utrecht, Netherlands.
- Evaluating the Mysteries of Seismicity in Oklahoma includes an analysis of the cumulative spatial influence of factors related to seismicity in the state, as well as several earthquake magnitude hotspot analyses.
- Town of Chebeague Island Sea Level Rise Vulnerability Assessment is a story map version of a report of the same name by the Greater Portland (Maine) Council of Governments.
- Analyze vector-borne disease with the ArcGIS Predictive Analysis Tools includes the analytic use case of predicting Aedes habitat and suitable locations for vector borne disease, along with a peer-reviewed journal article by Esri solution engineer, Dr. David Attaway et al. on risk analysis for dengue suitability in Africa.
- Connecticut's Changing Landscape uses live image services in a rigorous study of land cover change within that state rom 1985-2010.
- EPA's Climate Resilience Evaluation and Awareness Tool (CREAT) Climate Scenarios Projection Map provides easy-to-access scenario-based climate change projections for a variety of different scenarios across the US.
- The Bureau of Reclamation's Climate Change and Water details and visualizes projected changes in temperature, precipitation, and snowpack across the eight major Reclamation river basins illustrated in it's SECURE Water Act Report to Congress. It also allows for direct downloads of the data directly from the story map.
- The Chesapeake Bay Program and Region 3 of the EPA present Cleaner Air, Cleaner Bay to describe benefits from Clean Air Act regulations that decrease NOx emissions through implementation of the Chesapeake Bay Total Maximum Daily Load (TMDL).
- Sea Level Rise and Storm Surge Effects on Energy Assets assesses the potential sea level rise and storm surge risks to energy assets in the Metropolitan Statistical Area (MSA) of specific cities in the United States.
- Evolution of the 2010-2015 Texas Drought highlights research of the NOAA Climate Program Office's Modeling, Analysis, Predictions, and Projections program to better monitor, understand, and predict drought. See also Esri's Drought Tracker.
- 2013 Colorado Flood Recovery: Three Years of Progress illustrates various analytics and resulting advances made in recovery efforts since that major event.
- The Rise of the Andes in Ignimbrite Super Eruptions explores the Neogene geologic history of the Andes mountains, links geochemical and spatial patterns of ignimbrite super-eruptions to uplift and the crustal evolution, and highlights the potential of GIS to analyze and share scientific data (references).
- Useful workflows for drone point cloud classification to help you unlock the insights in your drone imagery.
- When Rising Seas Hit Home is a national analysis by the Union of Concerned Scientists that identifies WHEN hundreds of US coastal communities will face chronic inundation and possible retreat as sea levels rise. Users can explore these communities and discover not only the consequences of rising seas, but viable solutions.
- The StormSense Project highlights some of the methodology behind forecasting flooding from storm surge, rains, and tides.
Winners of the 2016 Global Content Challenge were required to use spatial analysis and submit entries as a classic Story Map Journal:
LAND
- First place: Sara Lubkin, N. Virginia Community College, USA, What Can Beetles Tell Us About Past Climates?
- Second place: Karl Chastko, McMaster University, Ontario, Canada, Food, Water and 7 Billion People: Improving Water Efficiency in Agriculture
- Third place: Kayla Wong, McMaster University, Ontario, Canada, Soil Carbon Sequestration Potential Based on Soil Properties
- Honorable Mention: Danielle Derrick, Carleton University, Canada, A Race for Survival: The Future of Tiger Conservation
OCEAN
- First place: Alicea Zelesny, University of Wisconsin-Madison, USA, Antarctica - The Southerly Extreme
- Second place:Julia Portmann, Washington College, Maryland, USA, Attack of the Blobs
- Third place: Kevin Yang, McMaster University, Ontario, Canada, Climate Change in Earth's Polar Regions
- Honorable Mention: Maggi Klug, University of Alabama-Huntsville, USA, Devastating Effects of Climate Change on Coastal Florida
POPULATION
- First place: Claudia Caceres, Claremont Graduate University, California, USA, Analyzing the Relationship between Climate Change and Food Insecurity in Developing Countries
- Second place: Michael Kirchin, McMaster University, Ontario, Canada, The American People
- Third place: Spencer Elford, McMaster University, Ontario, Canada, Concrete Jungle: Urban Expansion and the Rise of the Megacity
- Honorable Mention: Kathryn Kulbicki, George Mason University, Virginia, USA, Child Welfare in the News: August 1 to October 31, 2016
- Honorable Mention: Christopher Koido-Bunt, McMaster University, Ontario, Canada, Volcanic Hazard Risk in East and South East Asia
Analysis in the field, or stories of data collected in the field as inputs for spatial analysis, are also very important:
- Weather, climate, and space weather field and lab work at NOAA Boulder
- 2016 Post-Hurricane-Matthew data acquisition via dual-aircraft operations of the US Army Corps of Engineers Joint Airborne Lidar Bathymetry Technical Center of Expertise
- Wave and Shoreline Analysis courtesy of the Coastal Data Information Program, Scripps Institution of Oceanography, southern California
- Tufts University Campus Biodiversity Assessment showcases results from "an initial inventory of the wildlife and species present, with emphasis on identifying potentially rare or threatened birds, amphibians, reptile and mammal species in addition to their suitable habitats. This allowed for researchers, campus administrators, and community members to interactively visualize the locations of these species, and understand best practices for sustaining wildlife and suitable habitats throughout the Grafton Campus."
- Updated! Oregon State University’s HJ Andrews Experimental Forest Dashboard shows real-time data from 125 different environmental sensors, as well as real-time web-cams. Related blog post.
- Field studies of the 2013 Current Creek Fire in Lake Clark National Park, Alaska.
- Understanding the impacts of the 1964 Great Alaska Earthquake by the USGS.
- Scientific projects and field sites of the NOAA Biogeography Program.
- Field studies of the Geology of the Black Hills by the South Dakota School of Mines and Technology.
- Study areas of spatial analysis exercises featured in the Esri Press book, The GIS Guide to Public Domain Data by Joseph Kerski and Jill Clark.
- Post-Hurricane-Sandy resilience and recovery field sites of the US Fish & Wildlife Service
- Can't resist including this story map journal that uses ArcGIS 3D web scenes instead of web maps: Mountains of Fire, Touring the World's Deadliest and Most Active Volcanoes
- A Geologist in Grand Canyon
- A related post: Simple Real-Time Dashboards Built with Story Maps
- Alaska Revealed: High Resolution Elevation Data. A nice complement to the Columbia Glacier story map mentioned above.
- Mactaquac Aquatic Ecosystem Study (MAES) (Canada). See just about all the field aspects of this "multi-year assessment of the structure and function of the Saint John River ecosystem, followed by a manipulation of flow, sediment load, and thermal regime with consequential effects on the ecosystem, and then a multi-year period to monitor the recovery to a new river state."
You must be a registered user to add a comment. If you've already registered, sign in. Otherwise, register and sign in.