- Home
- :
- All Communities
- :
- Products
- :
- Spatial Statistics
- :
- Spatial Statistics Questions
- :
- Statistics and travel time
- Subscribe to RSS Feed
- Mark Topic as New
- Mark Topic as Read
- Float this Topic for Current User
- Bookmark
- Subscribe
- Mute
- Printer Friendly Page
Statistics and travel time
- Mark as New
- Bookmark
- Subscribe
- Mute
- Subscribe to RSS Feed
- Permalink
Hello,
Does anyone know a good way to express the difference in travel time from the same demand to a set of facilities? Let's say you use OD cost matrix to find the closest distance to two seperate facilities. Also, is it useful to regress variables to travel time, and how could this be done?
- Mark as New
- Bookmark
- Subscribe
- Mute
- Subscribe to RSS Feed
- Permalink
It really relies upon the attribution of your network dataset. If it is every basic, the only 'cost' of traversing the network the solver can use is distance. If the network has a time cost / speed limit etc you can use this as an impedence value in the Analysis Settings window as opposed to distance. The OD solver output will then reflect that.
Of course if you assume your travel speed along the network to remain unchanged, a simple distance/speed calculation would do it. e.g. 10km/10kph = 1 hour travel.
- Mark as New
- Bookmark
- Subscribe
- Mute
- Subscribe to RSS Feed
- Permalink
Hi, thanks for the reply. I think I may have formulated myself wrong. What I really wonder is how to properly express the results. If two cost-matrixes are calculated from the same demand and the result is expressed in minuttes, what can then be done with the result in statistics other than looking at mean travel time with the minuttes cost impedance?
is it worth it to use getis ord gi for instance? Can I compare travel time from two different calculated od cost matrix’s and and use correlation?
- Mark as New
- Bookmark
- Subscribe
- Mute
- Subscribe to RSS Feed
- Permalink
Why are 2 matrices being calculated? Are you changing the number of destinations for each? Facility and Demand terminology refers to Location Allocation problems, OD Cost Matrix is Origin / Destination (as far as my understanding permits).
I'm really sorry but I'm not getting a good grip of this question, but it might just be my fault. However, a picture paints a thousand words and will likely help others to answer this if I can't.
- Mark as New
- Bookmark
- Subscribe
- Mute
- Subscribe to RSS Feed
- Permalink
Both matrices use a different set of destinations, so for example origins to casualty clinics, and origins to hospitals. Both selects 1 destination. This will give the travel time to the nearest destination in both matrices from the same origin. And if you join them next to each other, the same point will reveal travel time in minuttes to the closest destination in both destination-types. So let’s say point 1 out of 4000 says that nearest hospital is 29 minuttes away, while the nearest casaulty clinic is 17 mins away. How can I better compare the two in the whole table other than just using mean, is my question. I want to generate statistics on them that expresses the difference. I realize something like percentile or quantile may work well, But could I go further?:)
thanks for your effort, David! Appreciate it
- Mark as New
- Bookmark
- Subscribe
- Mute
- Subscribe to RSS Feed
- Permalink
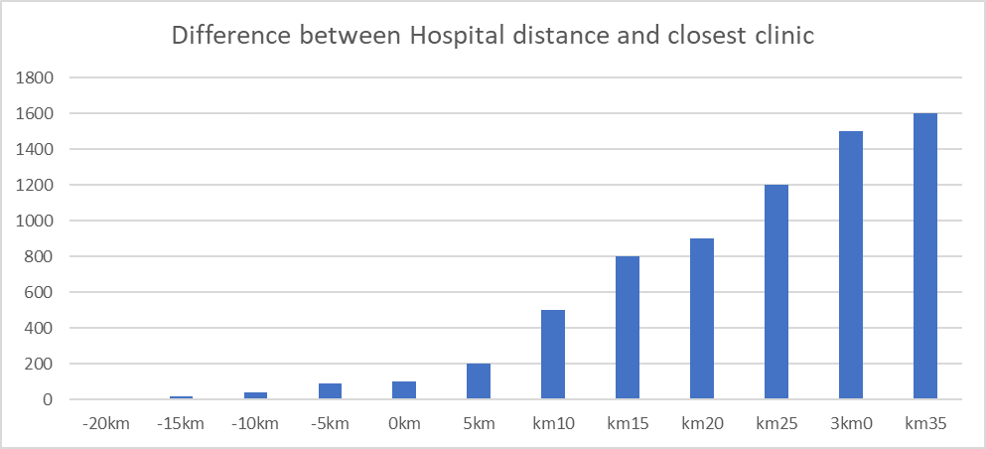
My excel graph skills are non existent. maybe something like the below fake histogram (I hate excel) where you could then maybe create a probability density for travel differences, statistically break it into SDs and quartiles etc?