Turn on suggestions
Auto-suggest helps you quickly narrow down your search results by suggesting possible matches as you type.
Cancel
- Home
- :
- All Communities
- :
- Products
- :
- Spatial Statistics
- :
- Spatial Statistics Questions
- :
- Spatially analyzing tree sway patterns
Options
- Subscribe to RSS Feed
- Mark Topic as New
- Mark Topic as Read
- Float this Topic for Current User
- Bookmark
- Subscribe
- Mute
- Printer Friendly Page
Spatially analyzing tree sway patterns
Subscribe
2923
1
04-10-2014 10:11 AM
04-10-2014
10:11 AM
- Mark as New
- Bookmark
- Subscribe
- Mute
- Subscribe to RSS Feed
- Permalink
Hello,
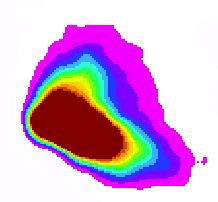
I am a master's student working on tree sway analysis. I use ArcGIS to create point density contours of each tree's movement over time. I have points of a tree's location as it moves in the wind every 1/10th of a second for an hour, which I import as X and Y spatial data. I then use Spatial Analyst to create a point density contour of the tree's location. I have attached an image of an example of tree sway. I would like to be able to quantify the spatial distribution/pattern of the contours, but am unsure how. I can turn the outline of the outer contour into a polygon - however I am unsure how to get spatial information about the shape of sway. I would love to figure out a way to look at the symmetry of the shape, or perhaps the longest axis of symmetry (what direction the tree is swaying in) (perhaps by quadrant so I can quantify trees that sway in more than one primary direction). I also have the point data I used to create this contour which I could analyze for spatial patterns, etc.
Any idea or suggestions is greatly appreciated! Thank you!
Jenna
1 Reply