- Home
- :
- All Communities
- :
- Products
- :
- Spatial Statistics
- :
- Spatial Statistics Questions
- :
- How to calculate spatial GINI coefficient
- Subscribe to RSS Feed
- Mark Topic as New
- Mark Topic as Read
- Float this Topic for Current User
- Bookmark
- Subscribe
- Mute
- Printer Friendly Page
How to calculate spatial GINI coefficient
- Mark as New
- Bookmark
- Subscribe
- Mute
- Subscribe to RSS Feed
- Permalink
Hello all,
I am interested in calculating an index of agricultural land inequality for Brazil. I'm thinking that a GINI coefficient would be a good approach given traditional uses of GINI, but I'm open to other approaches.
I have a data set for all municipalities in Brazil that consists of four columns for each municipality (rows): 1) number of family farms, 2) area occupied by small farm land use; 3) number of non-family farms; 4) area occupied by non-family farms.
What's I'm really hoping to attain is a value that can represent the relations between percent area occupied by non-family farms in comparison with family farms.
I can obtain the total area of the municipality from municipality shape file, but I don't think it makes sense to have a simple ratio of non-family farm area/municipality area as there will be various other forms of land use.
Any suggestions on how to calculate a spatial GINI using this data set, or a different statistic that makes more sense would be greatly appreciated
- Mark as New
- Bookmark
- Subscribe
- Mute
- Subscribe to RSS Feed
- Permalink
background and formula for those on the social side of gis
Gini coefficient - Wikipedia, the free encyclopedia
Dr Google for country specifics and its application. In short there are no built-in tools, for direct calculation, but given the data and existing tools, it can probably be calculated
- Mark as New
- Bookmark
- Subscribe
- Mute
- Subscribe to RSS Feed
- Permalink
There is nothing a little Python can do, and with numpy ace Dan in this thread you're have way there. I came across this thread which has a lot of potential (using numpy.trapz):
http://stackoverflow.com/questions/31416664/python-gini-coefficient-calculation-using-numpy
The Gini coefficient was originally developed to measure inequality, using cumulative share of people from lowest to highest incomes (x-axis) vs Cumulative share of income (y-axis). How would you define the values for both axis in your case? Cumulative share of non family owned farms vs cumulative share of family owned farms, order by the fraction (family farms / non family farms)?
- Mark as New
- Bookmark
- Subscribe
- Mute
- Subscribe to RSS Feed
- Permalink
This 0.596375
and this...
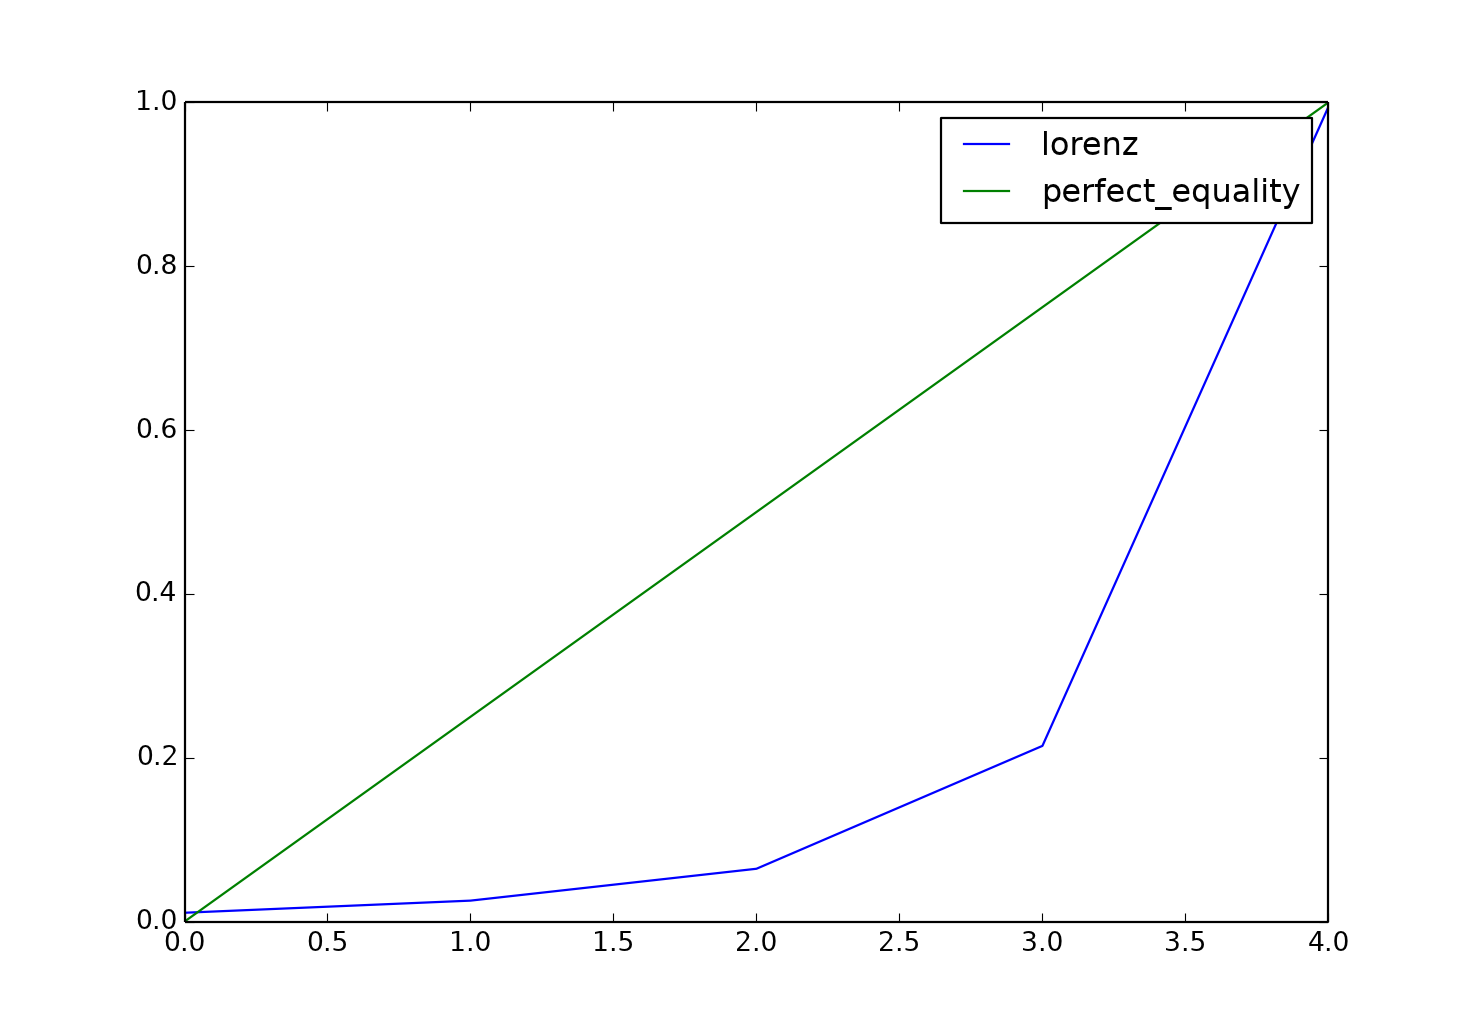
from this
#
# coding: utf-8
import numpy as np
from matplotlib import pyplot as plt
from numpy import trapz

GDP = 6532000000000
factors = np.array([0.49,0.59,0.69,0.79,1.89,2.0,5.0,10.0,18.0,60.0])
prep = factors*GDP/100
A, B, C, D, E, F, G, H, I, J = prep
q_s = prep.reshape((5,2))
Q1, Q2, Q3, Q4, Q5 = np.sum(q_s,axis=1)
Qs = np.sum(q_s,axis=1)
# Calculate the percent of total income in each quintile
Ts = ((100.*Qs)/GDP)/100.
TR = np.sum(Ts)
# Calculate the cumulative percentage of household income
y = np.cumsum(Ts)
# The y values. Cumulative percentage of incomes
# The perfect equality y values. Cumulative percentage of incomes.
y_pe = np.linspace(0.0,1.0,len(y))
# Compute the area using the composite trapezoidal rule.
area_lorenz = np.trapz(y, dx=5)
# Calculate the area below the perfect equality line.
area_perfect = np.trapz(y_pe, dx=5)
# Seems to work fine until here.
# Manually calculated Gini using the values given for the areas above
# turns out at .58 which seems reasonable?
Gini = (area_perfect - area_lorenz)/area_perfect
#
print(Gini)
plt.plot(y,label='lorenz')
plt.plot(y_pe,label='perfect_equality')
plt.legend()
plt.show()
And no guarantee it is even remotely correct.
- Mark as New
- Bookmark
- Subscribe
- Mute
- Subscribe to RSS Feed
- Permalink
I see you simplified the code. Looks better this way!
- Mark as New
- Bookmark
- Subscribe
- Mute
- Subscribe to RSS Feed
- Permalink
Are the input style the same? ie with the coefficients etc?
It can easily be rolled into a function or tool...but as I said, I know nothing about GINI except as an Italian soft drink
- Mark as New
- Bookmark
- Subscribe
- Mute
- Subscribe to RSS Feed
- Permalink
Hi David Meek , I you have some sample data you could share, this would help to see if the calculation makes sense. Maybe afterwards the relative position of the municipality can be visualized in GIS. Because the result of Gini coefficient is a single value and if you are applying it using data that is normally not used for this calculation, how will you interpret this single value?
- Mark as New
- Bookmark
- Subscribe
- Mute
- Subscribe to RSS Feed
- Permalink
Hi Xander Bakker and @Dan Patterson, many thanks for the starting points and suggestions.
Attached is an excel sheet that shows the data (I translated a little of it from Portuguese to help).
I'll note that while the GINI was developed for income inequality, it's been used to measure inequality in terms of a variety of other variables, including land through a GIS framework. See this recent article: PLOS ONE: The Land Gini Coefficient and Its Application for Land Use Structure Analysis in China (attached is the .pdf). So it seems definitely possible, but A) I'm not sure whether the data I have are appropriate, and B) I'm not a statistical whiz, so while I can follow a geostats tutorial, decoding the equations is beyond me.
Additionally, to provide more background, what I'm ultimately seeing to do is to develop a GINI value for each municipality in Brazil, and then have that as an attribute field that I can include as part of a larger OLS/GWR regression analysis. Xander, I might be wrong, but I think that if I have this value for each municipality I can analyze differences in land inequality between municipalities.
Also, it's possible the GINI isn't the right stat for this, and I'm definitely open to suggestions of other approaches that make sense given these data.
- Mark as New
- Bookmark
- Subscribe
- Mute
- Subscribe to RSS Feed
- Permalink
Ok... more to the question... do you know how to use a script?
I just replicated Xander's link in simpler terms but I don't know whether it works for your data... so is the structure of the inputs and outputs what you want for your data?
I will leave interpretation of such things to you...
- Mark as New
- Bookmark
- Subscribe
- Mute
- Subscribe to RSS Feed
- Permalink
I have a very basic understanding of scripts, but sadly, it's been a few years since I've done anything with python. I might have found a source for these data on the GINI directly. Will report back if I proceed with this analysis.