- Home
- :
- All Communities
- :
- Industries
- :
- Science
- :
- Science Blog
- :
- Esri and the Scientific Community: A Portfolio
Esri and the Scientific Community: A Portfolio
- Subscribe to RSS Feed
- Mark as New
- Mark as Read
- Bookmark
- Subscribe
- Printer Friendly Page
Updated: January 14, 2019
THIS PAGE IS NOW AN ARCHIVE AND WILL NO LONGER BE UPDATED.
LATEST UPDATES, AS OF SEPTEMBER 10, 2019, ARE NOW AT www.esri.com/sciences
Jump to: Major Initiatives | Collaborative Projects | Staying Connected | Deepsea Dawn
UC Science Symposium Hot! | R - ArcGIS Integration Hot! | ArcGIS Python API Hot! |
Geo AI & Machine Learning Hot! | DID YOU KNOW?
Science at Esri continues to evolve on many exciting fronts, as we focus on supporting both basic and applied science, while also recognizing that there are many major themes of compelling interest to society that will drive scientific research for the next several decades. Thus we view science as helping us to understand not only how the Earth works, but also how the Earth looks (e.g., by way of geodesign), and how we look at the Earth (i.e., by way of Earth observation in varying forms and the accompanying data science issues of analysis, modeling, developing and documenting useful datasets for science, interoperating between these datasets and between various approaches). These are, in fact, examples of The Science of WhereTM.
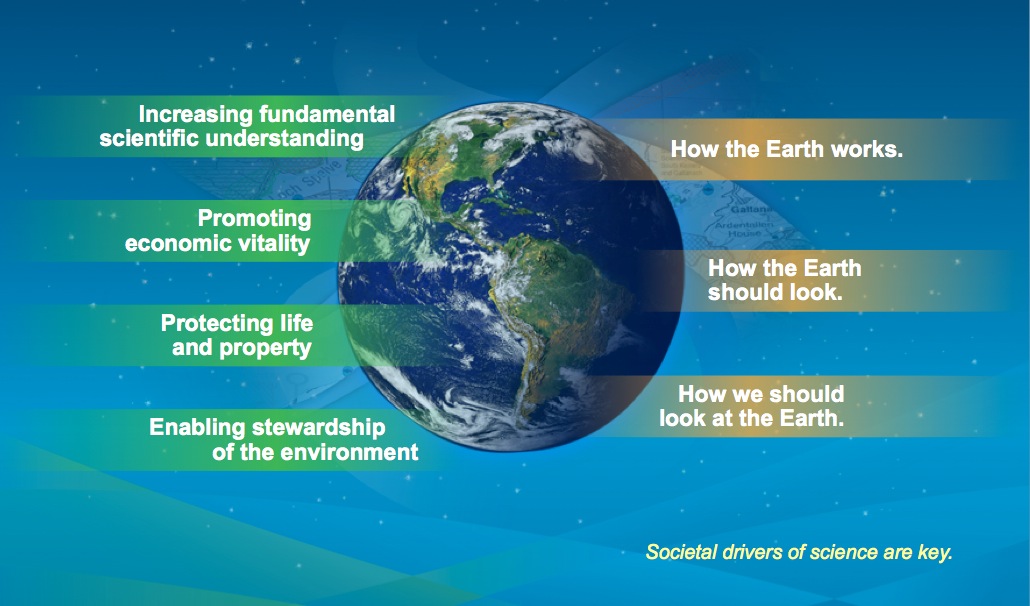
There are many major themes of compelling interest to society that will drive scientific research, at least for the next two decades. And thus we view science as helping us to understand not only how the Earth works, but how the Earth should look, and how we should look at the Earth.
In addition to supporting the science community, we seek to do good science at Esri ourselves, as it underpins much of what we do as an organization. This is helping us to evolve ArcGIS into a comprehensive geospatial platform for science; a platform that supports research project management and collaboration, spatial analysis, visualization, open data, and communication of science, all at multiple scales (i.e., from individual researcher to lab workgroup, to multi-department, multi-university, university-to-agency collaboration, to citizen engagement).
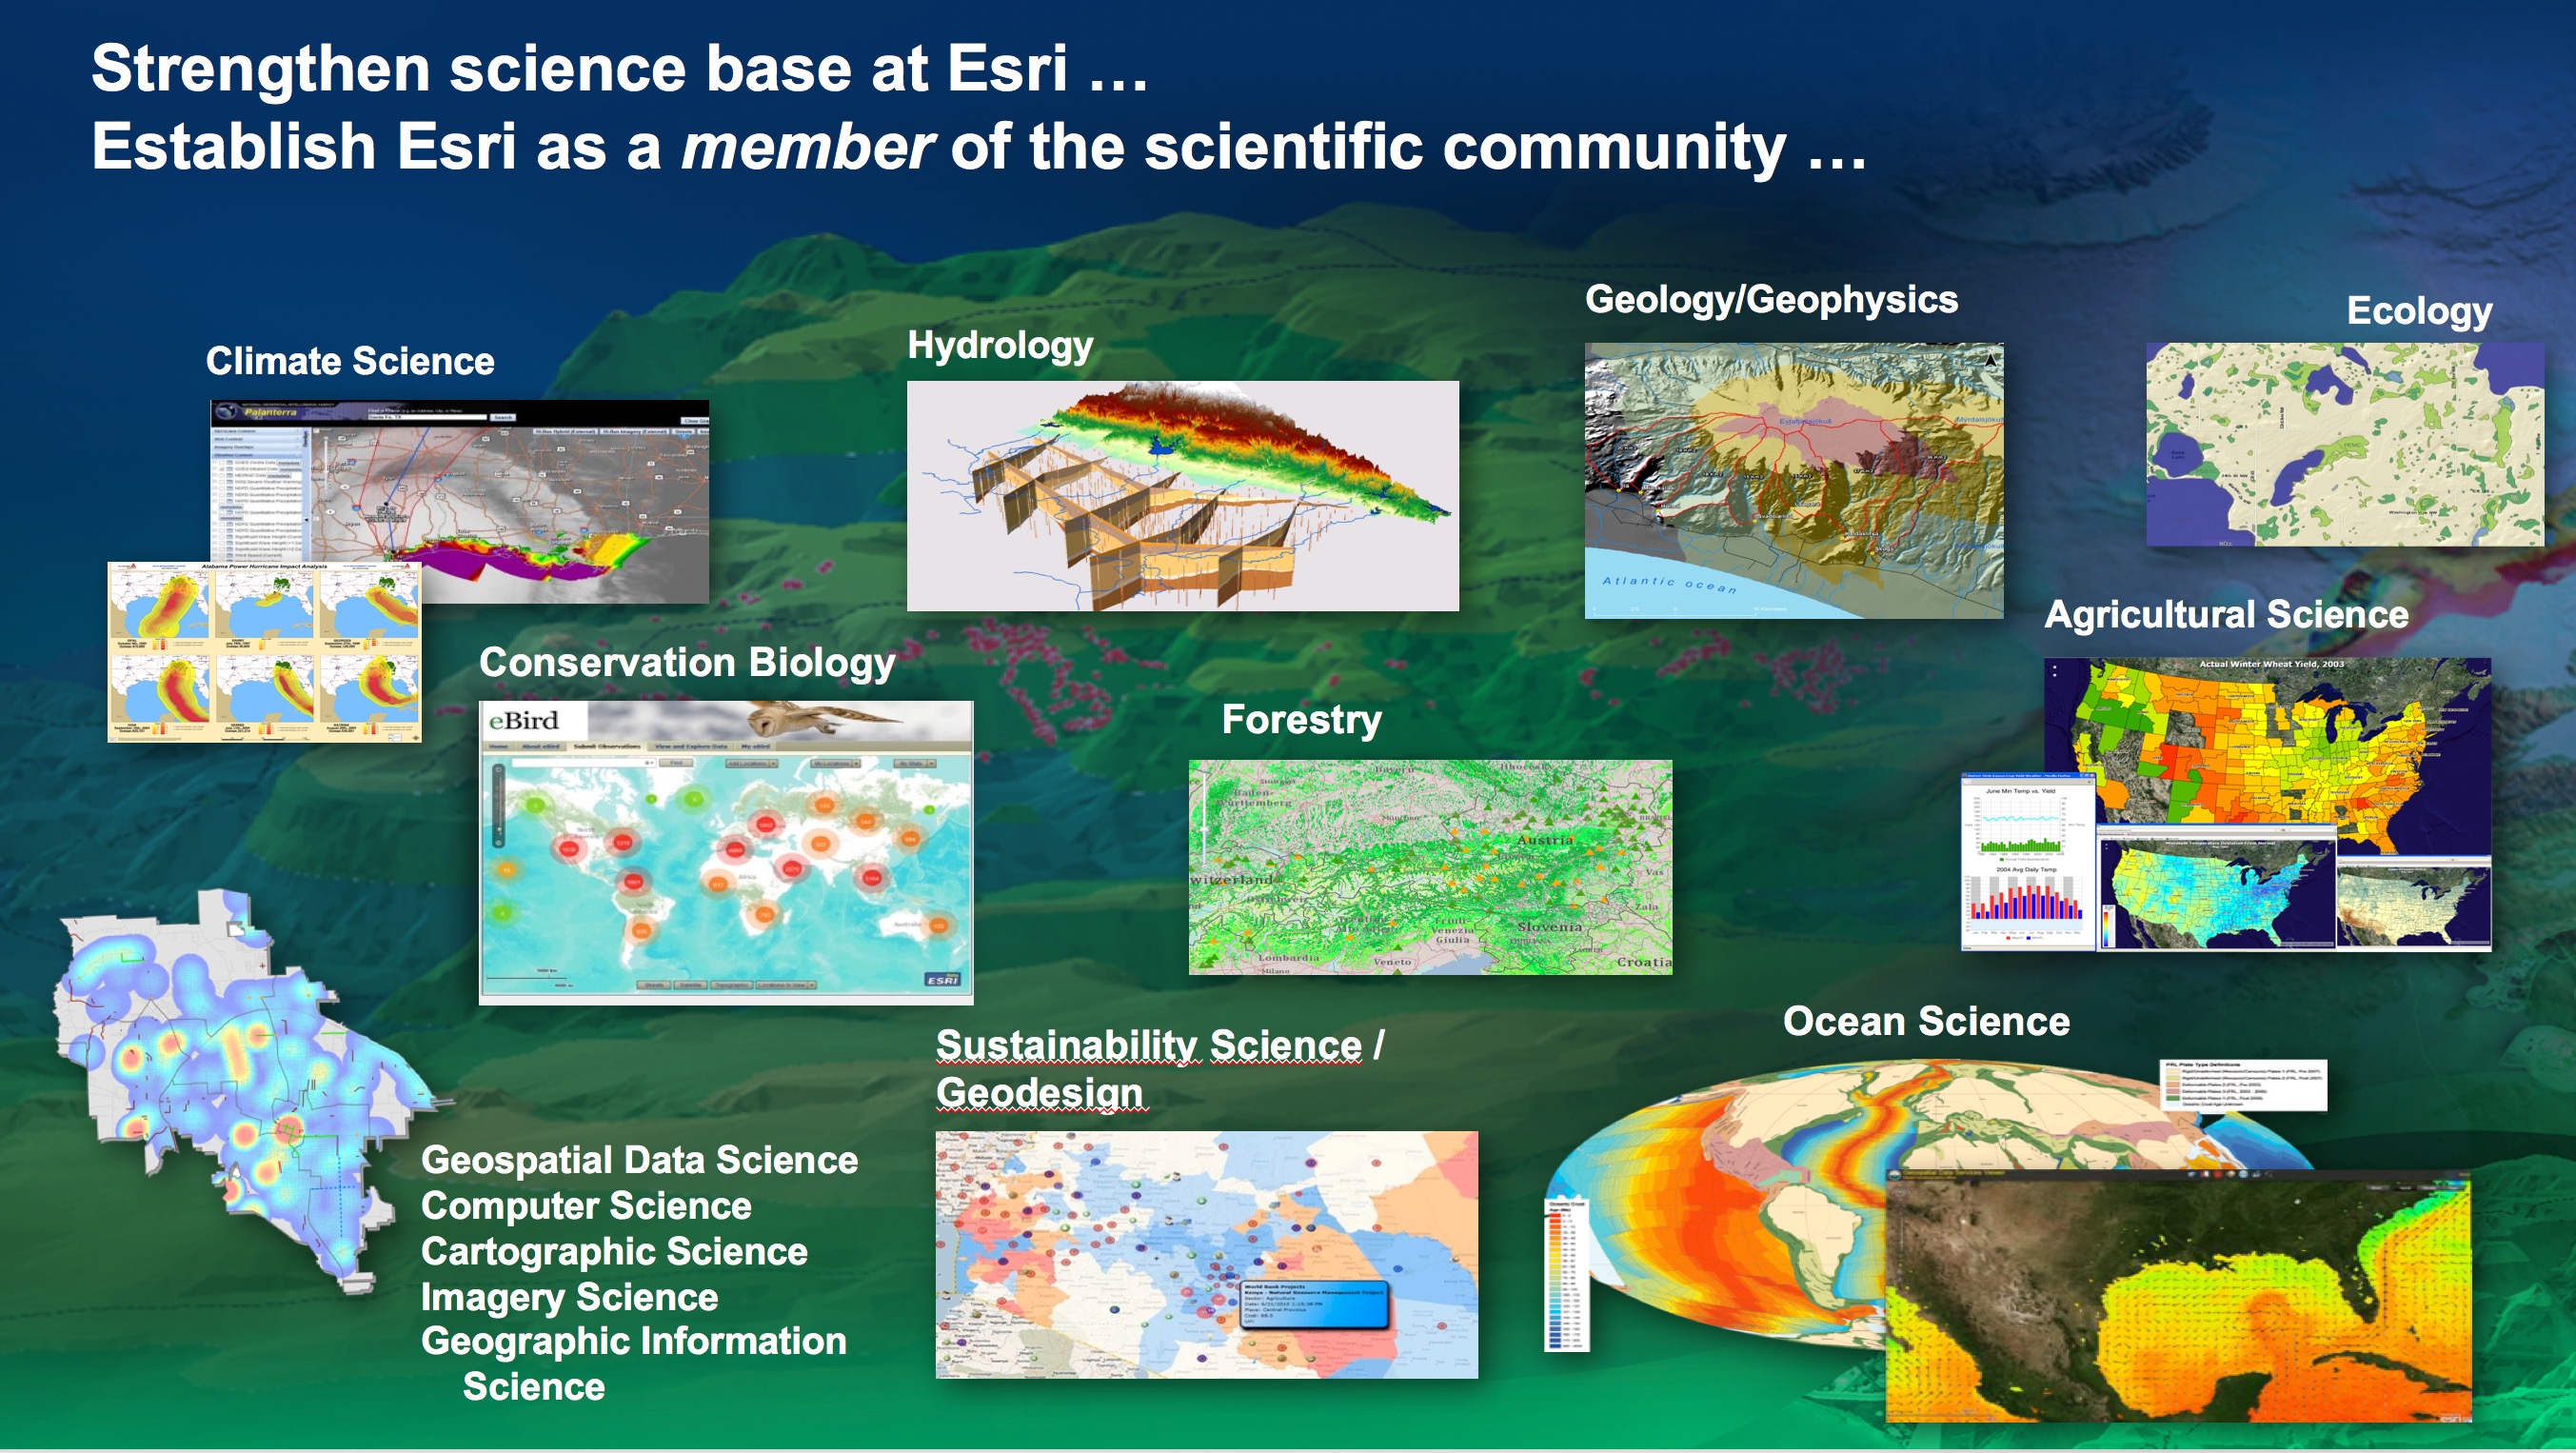
There are many natural science domains in which GIS is being used effectively to understand how the Earth works. At Esri, these are the sciences that we are particularly strong in.
Along these lines, Esri is fairly well known to research labs, universities, and other places where great science is done as a vendor of GIS technology. However, Esri continues to work toward contributing as a MEMBER of the scientific community as well. We define the "science community" as scientists within universities, research institutes, government agencies, non-governmental organizations (NGOs), and similar. As such, Esri maintains objective scientific representation on various scientific boards and councils, including several of the committees within these bodies that accomplish important tasks over the long-term. Examples include:
- the National Academy of Sciences Geographic Sciences Committee
- New! the US Geospatial Intelligence Foundation Board of Directors
- New! the GEBCO Technical Subcommittee on Ocean Mapping
- New! the American Meteorological Society (AMS) Board on Global Strategies
- New! Directors Council of the Scripps Institution of Oceanography
- the Science Advisory Council of Conservation International
- the University of Minnesota Institute on the Environment External Advisory Board
- the Scientific and Technical Advisory Board of 52 North
- Commissions and Working Groups of the International Cartographic Association
- the National Geographic Society Board of Trustees
- the National Water Forecasting Program Advisory Board
- ISO TC/211 (International Standards Organisation Technical Committee) liaison to the United Nations Statistics Division
- the UN Expert Group on the Integration of Statistical and Geospatial Information
- the Maritime Alliance Board of Directors
- the NatureServe Strategic Advisors Council
- the National Geospatial Advisory Committee
- the Federation of Earth Science Information Partners (ESIP)
- various committees and the Board of Directors of the Open Geospatial Consortium (OGC)
- the Vespucci Initiative for the Advancement of Geographic Information in Science
- the Consortium for Ocean Leadership
- US National Committee for the International Cartographic Association (ICA)
- Liaison Team of the National Science Foundation (NSF)-funded EarthCube Initiative. See this blog post.
- Board of COMPASS Science Communication, Inc. (past)
- the World Ocean Council
- the International Hydrographic Organization and various Marine Spatial Data Infrastructure committee throughout Europe and South America
- the National Academy of Sciences Ocean Studies Board (past)
- the inaugural board of the Citizen Science Association (past)
- the National Science Teachers Association editorial review panel for Science Teacher magazine (and as an example of the many journal and magazine editorial boards that Esri staff serve on)
- the NOAA Science Advisory Board (past)
- the Department of Commerce Data Advisory Council (CDAC)
- the Census Scientific Advisory Committee (CSAC)
- and more ....
Esri also serves on various advisory boards or collaborative research teams for specific scientific projects, such as:
- GEO/GEOSS: See this blog post for more information.
- The NSF-funded Research Coordination Network (RCN) on Ocean Observations
- Various interest and working groups of The Research Data Alliance (RDA)
- the Industrial Associates Program of the University of New Hampshire (UNH) Center for Coastal and Ocean Mapping (CCOM) Joint Hydrographic Center (JHC)
- Various engagements of our National Government Sciences and Civilian Teams
- the Obama White House Climate Data Initiative and Partnership for Resilience and Preparedness (PREP) + related resources
Our Major Initiatives and Projects
- Open Source, Open Data, Standards, and Interoperability: Leveraging open source code and solutions with Esri technology is something that the scientific community is very much interested in. However, many in the science community are still surprised to hear that Esri produces free, open-source products such as Geoportal Server (which continues to be a popular and valuable contribution) or maintains a significant presence on GitHub. There is also the ArcGIS Editor for Open StreetMap. Further, did you know that as a company, we are currently leveraging and contributing to over 200 open-source projects, while delivering over 350 open-source projects of our own? Esri software provides direct read, import, and export for over 300 formats, including over 200 image formats and sensors. Esri supports over 100 geospatial standards (including those from ISO TC 211 and OGC), and provides open access to scores of APIs and SDKs. In any platform strategy, being open, interoperable, and standards-compliant actually makes very good business sense. See also these excellent summaries and blog posts:
- VIDEO: Esri President Jack Dangermond & Standards Product Mgr/Open Strategist Satish Sankaran in a spirited discussion about and overview of standards, interoperability, #opendata, Python APIs, open software libraries, and Esri's participation going forward.
- Hot! Integration with R with related post, project announcement, and related video.
- Hot! Integration with the Python Spatial Analysis Library (PySAL) for geospatial analytical computation
- See also this comprehensive video on integrating open source statistical packages with ArcGIS. In addition, see Python: Working with Scientific Data.
- Open.Esri.Com (including Resources)
- ArcGIS Open Data and Hub from our Esri Washington DC Development Center
- Integration of ArcGIS with the SciPy Stack
- New Python Raster Functions, a curated set of lightweight but powerful tools for on-the-fly image processing and raster analysis in ArcGIS. Available from Esri's open-source community on GitHub.
- A host of APIs and runtime SDKs for developers, many from our Esri Portland (Oregon) Development Center
- Our new ArcGIS Python API which lets you engage with data, analytics, and visualization through a clean Python API. See also this Chennai Floods analysis sample and video intro about using the API with The Jupyter Notebook.
- Esri has a new initiative in Artificial Intelligence and Machine Learning. We now have "GeoAI" resources and demos on GitHub (must be signed in), and a series of articles on Medium about workable, innovative machine learning implementations in ArcGIS. See also The Science of Where Seagrasses Grow: ArcGIS and Machine Learning. Esri has also entered a new partnership with Microsoft in the realm of Artificial Intelligence that includes Esri technology now incorporated within Microsoft's Data Science Virtual Machine (i.e., ArcGIS Pro and the R-ArcGIS Bridge). Researchers can now apply for cloud computing grants under this initiative. This is part of Microsoft's exciting new AI for Earth Initiative which may become "a game-changer for our planet."
- Tools and workflow packages such as Scientific Data Workflows, and Dimension Explorer, and 3D Fences and Curtains. See more at ArcGIS Code Sharing.
- Fostering compelling cartography, design, and research as part of the amazing world of cartographic science (including Adventures in Mapping, Maps We Love and the definitive text Map Use: Reading, Analysis, Interpretation. See also the related Cartography MOOC (Massive Open Course).
- Release of the First Ecological Land Units (ELUs) Map of the World. GEO/GEOSS commissioned the USGS to create a new map of global terrestrial ecosystems for a host ecosystem research and management applications, including assessments of climate change impacts to ecosystems, economic and non-economic valuation of ecosystem services, and conservation planning. Under the leadership of Dr. Roger Sayre of the USGS, in collaboration with Esri and several agencies and organizations, global terrestrial ecosystems are now characterized in an ecophysiographic stratification comprised of nearly 4000 terrestrial ELUs, at a base resolution of 250 m. Datasets from the study are shared in a series of web services as part of the Living Atlas of the World, thereby representing the most current, accurate, comprehensive, and finest-resolution available globally for each of the four inputs: bioclimate, landform, lithology, and land cover. This project was officially released at the 2014 ACES Conference (A Community on Ecosystem Services) in December. See the related blog post, technical report, story map, web app, and an ArcGIS content white paper.
- To complement the Ecological Land Units, we have also built the first ever, robust, standardized, data-derived map of global marine ecosystems, the Ecological Marine Units (EMUs). The project was commissioned as an official task for the second decade (2016-2025) of the Group on Earth Observations (GEO), as part of the GEO Global Ecosystems (GECO) initiative. An initial advisory group includes scientists from the USGS, University of Auckland, GRID-Arendal, the Marine Conservation Institute, NatureServe, NOAA, and Duke University. The environmental stratification approach will involve creating an empty, volumetric column-based mesh as a global, spatial reference standard and analytical framework, populating the spatial framework with relevant marine physical environment data including water column variables and seafloor geomorphological features, and clustering the abiotic data into ecologically meaningful, 3D regions represented as volumetric polygons. The EMUs will subsequently be analyzed against species distribution data to assess strength of relationship between distinct abiotic environments and species biogeography. Initial results were presented at the Global Marine Protected Areas Summit and the Esri Ocean GIS Forum, both in November. See video 1 and video 2, as well as this 2017 News feature in the journal Nature.
- Ecological Coastal Units (ECUs) are now in production! Stay tuned!
- A Global Population Map. For many years, Esri has been compiling a human geography database of demographics and statistics about all countries in the world, and mapping these datasets using an innovative methodology. See info on Esri's new World Population Estimate, a probability surface that estimates the location and count of people worldwide, freely available to researchers.
- Spatial Analysis including Spatial Statistics: Several collections of tools in ArcGIS Pro and ArcMap include scores of new functions for space-time pattern analysis and mining (including space-time cube visualization and analysis of changes in temporal trends at a location), raster segmentation and processing, working with 3D and LAS (LiDAR) datasets, pairwise feature processing, suitability modeling, cost distance analysis, data review, and workflow management. For the latest from our Spatial Statistics team, see the comprehensive Spatial Statistics Resources Site, frequently updated.
- Imagery: ArcGIS provides a comprehensive platform for working with imagery and making your imagery useful, including advanced image management and processing, and robust analysis tools. As example see how the NASA Langley Atmospheric Science Data Center (ASDC) Distributed Active Archive Center (DAAC) is improving the accessibility and use of Earth science data with this platform (esriurl.com/nasa and webinar video). And for over 9000 universities across the world this imagery platform and a wealth of imagery data are already freely available under their campus site licenses. See esrirul.com/imagery and some pretty amazing explorations of Landsat at esriurl.com/secrets. The new Imagery Workflows site shares a variety of tools and best practices for managing, analyzing, and using imagery and related rasters. See the related Earth Imagery MOOC (Massive Open Course).
- Big Data: Researchers today need to deal with an avalanche of data—from environmental sensor networks (both on land and at sea), social media feeds, LiDAR, and outputs from global- and regional-scale atmospheric circulation and general climate models and simulations. Because of this, “big data” has emerged as a major research theme for the academic community. In 2013, Esri developers released the GIS Tools for Hadoop Project on GitHub. The project contains an open source framework and API that enables big data developers to author custom spatial applications for Hadoop. The GIS Tools project also enables the ArcGIS platform to leverage big data on Hadoop using tools that combine custom Hadoop applications with the ArcGIS Geoprocessing environment. The project supports processing of simple vector data (points, lines, polygons) and basic analysis operations, e.g. relationship analysis on that data, running in a Hadoop distributed processing environment. See also this overview.
- Basemaps: Many in the scientific community are interested in and participate in our Community Maps Program. This is in the spirit of crowdsourcing of authoritative content from the community, that Esri then hosts free in the cloud and for which contributors retain ownership and are acknowledged. In terms of GIS analysis directly within the web browser, the geo-analytics web services that Esri offers for hydrologic science are the most advanced thus far.
- Story Maps: Story maps allow scientists to make their data and analyses more accessible to their colleagues as well as to policy-makers and citizens (example). Think of the power of telling a 30-second elevator speech about your research to a funder or policy-maker as a story map! Templates and tutorials are available at storymaps.arcgis.com. Related resources: An Ocean of Story Maps | Speaking the “Language” of Spatial Analysis via Story Maps | ArcGIS and Citizen Science.
- Great science books from Esri Press (with more to come): Imagery and GIS: Best Practices for Extracting Information from Imagery shows how imagery can be integrated successfully into GIS maps and scientific analysis. Mapping and Modeling Weather and Climate with GIS features leading climatologists, meteorologists, and other experts sharing approaches to advance atmospheric and ocean science through GIS. Ocean Solutions, Earth Solutions, 2nd edition, is an externally peer-reviewed research monograph based on papers presented at the inaugural Esri Ocean GIS Forum. It is about use-inspired science and realistic solutions for mapping, monitoring and protecting the ocean, hence the entire Earth. It is the first Esri Press book to employ Digital Object Identifiers (DOIs) for citation of both the book and its supplementary datasets (further reading on citations). GIS Research Methods: Incorporating Spatial Perspectives shows researchers how to incorporate spatial thinking and GIS technology into research design and analysis. It should also be incredibly useful in the classroom. Map Use, now in it's 8th edition, is a comprehensive, foundational textbook designed for undergraduate and graduate coursework, and newly updated with chapters on web mapping and web map design. Cartography. is a lavishly illustrated reference guide that skillfully navigates the intersection between science and art.
- Citizen science taking more center stage, including Esri participation at the inaugural Citizen Science Association Conference, a range of apps to support citizen science projects, and exciting implementations, including at the White House Science Fair. Apps include Collector for ArcGIS, Survey123, Crowdsource Reporter for Citizen Science, Water Quality Status, My Hazard, and for your own customized apps from scratch, Web App Builder for ArcGIS. The Story Map Crowdsource Builder for citizen science was released in 2015. See also this great overview of the latest Citizen Science Resources from Esri and partners, as well as the Federal Crowdsourcing and Citizen Science Toolkit.
- Various science-themed contests including prior: Global Disaster Resilience App Challenge Winners + Data Viz App Challenge Winners + Global Content Challenge Winners
- The Ocean: In 2012 Esri launched an Ocean GIS initiative across the entire Esri organization to enhance our capabilities to support GIS in both coastal and open ocean applications. As mentioned before in Esri Insider, Esri is particularly focused on a greater engagement with the ocean science community, as complex ocean science questions and data are increasingly used to inform the responsible use and governance of the oceans, as well as effective management and conservation. To support a better overall understanding of our oceans, Esri aims to improve and expand its products, tools, services, partnerships, and connections with the broader ocean community. We continue to evolve in this area via the annual Esri Ocean GIS Forum, held in November at our headquarters in Redlands, CA. We are also providing a wide range of ocean content through the Living Atlas of the World.
Across the entire Esri organization we have an Ocean GIS initiative that was built on a comprehensive strategic plan. We're also working with a growing list of terrific partners.
- A new site license (also known as the science kit) for standalone research organizations in the US.
- Many are still unaware of our Visiting Faculty/Sabbatical Program. If considering an extensive time in residence at Esri headquarters, please see these guidelines.
- Video of Esri's Research & Development (R&D) Centers Around the World
Collaborations with Partners in the Academic, Government, and NGO Sectors
- Updated! Continuing collaborations with NOAA, including support of their enterprise GIS operations within the National Weather Service, and within that the National Ice Center (NIC). The NIC's Satellite Image Processing and Analysis System is one of the assets ensuring safe navigation in polar regions for ships operating near, through, and beneath sea ice, guided by ArcGIS sea-ice and iceberg maps.
- Oak Ridge National Laboratory (ORNL) within the Department of Energy (DOE): Esri has entered into a semi-exclusive agreement with ORNL to distribute their LandSCAN and LandCAST data settlement mapping population data. LandSCAN is an authoritative, high-resolution (1-km), global dataset of population distribution. LandCAST is an empirically-informed spatial distribution of projected population of the contiguous U.S. for 2050 compiled on a 1-km grid. ORNL is also experimenting with the latest Esri platform capabilities for advancing their global and regional population density analyses. There is interest in Esri's new "accelerated processing" capabilities for applying ORNL's current algorithms for image extraction (e.g., buildings), as executed within ORNL's LandScan application, and in Esri's new orthorectification capabilities, and real-time collection of big data feeds.
- US Census and Housing and Urban Development (HUD): Collaboration efforts include modernization of enumeration, route optimization, change detection, and dissemination processes at Census, and development of the Community Assessment Reporting Tool (CART) at HUD to map and spatially explore investments by city, state, county, metropolitan area, or congressional district. Census is also testing raster analytics functions with remote sensing data in support of international surveys and the potential generation of supplemental, non-official products to assist with the 2020 Census.
- 52 North: Various projects focused on interoperable processing of sensor data and advancement of spatial data infrastructures via publish/subscribe interaction patterns. For example, Sharing Geoprocessing Tools via the Web (via OGC WPS).
- Clark Labs of Clark University has worked with us for many years on modeling of Landsat data for population and land footprint growth, as well as as landscape vulnerability. Their agent-based growth simulation modeling and land cover data are a critical ingredient in our evolving Green Infrastructure project. The Esri Green Infrastructure app compares changes between aggregated 2011 National Land Cover Database land cover categories with similarly aggregated land cover categories from The Clark Labs 2050 Conterminous US Land Cover Prediction. It also provides a few summary statistics about possible changes in developed, forest and agricultural land cover. Look for the soon to be released Clark Labs American Land Change Explorer application, which provides exhaustive analysis and summaries of potential transitions from each of the NLCD categories to each of the projected 2050 categories.
- University College London: Various small citizen science and urban risk/resilience projects, including story maps (example 1, example 2) with the Extreme Citizen Science (ExCiteS) lab of Professor Muki Haklay.
- NASA: various experiments, prototypes and with climate, ocean, and hydrologic multidimensional datasets particularly with the NASA Earth Science Technology Office. Additional collaborations are ongoing with the NASA Disaster Assistance Program.
- The GIS Program of the National Center for Atmospheric Research (NCAR) is working with us on developing a series of web services to provision climate data (e.g., netCDF) within the Living Atlas of the World to drive some amazing new apps, particularly in support of the NCAR Community Earth System Model (CESM). They have also worked with us on the development of a new LearnGIS module around the use of climate and weather data in GIS, and various other activities to further develop and strengthen the Weather, Climate and Atmospheric GIS Community.
- Esri is also pleased to be working with Columbia University's Center for International Earth Science Information Network (CIESIN) as part of their POPGRID Open Data Collective. POPGRID is a consortium of population and settlement modelers from both the public and private sector that are working on integrated approaches to human settlement, infrastructure, and population mapping, including in support of the UN Sustainable Development Goals (SDGs).
- University of Wollongong, Australia: Esri's Statistical Design Teams will be consulting with Distinguished Professor Noel Cressie and his research group on a range of development projects in areas including geostatistics, space-time pattern mining, R statistical software integration, and statistical clustering algorithms to optimize Esri ecophysiographic, ecological marine, and world population layers.
- MIT: Esri's Chief Scientist teamed with the Esri Story Maps and Strategic Marketing Teams in a collaboration with Dr. Amy Glasmeier, Professor of Economic Geography and Regional Planning. The aim was to explore how to better "spatialize" her famous Living Wage Calculator, which analyzes the minimum level of income required for individuals and families to pay for basic living expenses. The result was the Living Wage Story Map in 2015 (now updated in 2018 to The Ever Changing Minimum Wage), which received hundreds of thousands of web hits upon its launch, and was featured in dozens of media outlets such as The Atlantic and Huffington Post, The Washington Post, and Politico.
- Southern California Coastal Water Research Project (SCCWRP): Esri is working with SCCWRP on a variety of collaborative projects including the development of a desktop tool for the assessment of hydromodification via geomorphic landscape analysis. This assessment is focused on changes to stream runoff and sediment supply as a result of land use modifications. Also in the works are the design and development of decision-support tools for adaptation of coastal wetlands to sea level rise, and 3D visualizations for environmental decision support within estuaries.
- UCSB's Space and Time Knowledge Organization (STKO) Lab: Esri and the STKO Lab of Professor Krzysztof Janowicz and his students are pursuing joint research projects of mutual benefit and interest in the areas of Linked Data, semantic search, data-mining-based metadata enrichment, and geo-ontology. This includes experimenting with the ArcGIS ingestion of ontologies and Linked Data for data queries and the associated issues of user experience (UX), semantic search, automatic interpretation, web analytics, and more.
- The University of Bamberg in Germany partnered with Esri on a project focusing on GeoGames and Playful Design, as a medium for education in spatial thinking, for problem-solving in spatial design. The Bamberg team has studied and developed location-based games for different educational scenarios (e.g. river ecology, cultural heritage), and continues to develop prototypes of games and design tools based on ArcGIS technology. See the project info. at www.geogames-team.org.
- Indicator-based Interactive Decision Support and Information Exchange Platform for Smart Cities Planning (INDICATE): Our Zurich R&D Center partnered with IES (a leader in architecture, engineering, and construction or AEC simulation tools), Dublin Trinity College (providing numerical simulations), DHP Consulting (spatial planning experts), and D‘Appolonia (a large Italian AEC and connsulting firm) on this project. The goal is to create an interactive, instant Design-Validate-Feedback loop for urban planning, taking into account energy performance, livability. The project will also share best practices and their impacts using a neutral indicator framework to enable other to assess the effect of measures on their context.
- SAFECITI: The Esri Zurich R&D Center partnered with Next Limit (3D Rendering), Golaem (Crowd Simulation), and the Spanish National Police in creating a virtual-reality training and simulation environment for organisations with security mandates using procedural content and crowd simulation. The aim is to develop a simulation platform that will help analysts predict crowd behavior under certain threats in order to help the police develop better safety plans.
- Open Water Data Initiative: Esri is partnering with U-Texas-Austin, Kisters, the Open Geospatial Consortium (OGC), the US Geological Survey (USGS), the Consortium of Universities for Advancement of Hydrologic Science (CUASHI), and others in this project seeking to bring together water information for the whole Earth, at all spatial scales (global, regional, local), linking both geospatial and temporal information, and linking data with modeling.
- KIC-T: The Esri Zurich R&D Center is partnering with ETH Zurich, IBM Research, and Birmingham City University on using real-time data and simulation for urban planning for climate-change resilient cities. This involves extending the Esri GeoEvent Processor to provide streams of 3D events to the ArcGIS Web3D platform, and in researching and implementing new visualization methods for these real-time streams.
- Adaptive Composite Map Projections: In 2015 Esri completed a collaboration with Professor Bernard Jenny and his lab while at Oregon State University on integrating into the ArcGIS platform a composite adaptive map projection, which seamlessly morphs map space as the user changes map scale or the geographic region displayed (Jenny is now at Monash University in Australia). The composite projection adapts the map’s geometry to scale, to the map’s height-to-width ratio, and the central latitude of the displayed area by replacing projections and adjusting their parameters. The result is a scale-aware, adaptive projection, free of the constraint of having to deal with multiple zones or multiple sets of graticules, and ultimately free of the pitfalls of WEB MERCATOR!
- and many more.
Staying Connected
There are several ways to keep abreast of science developments at Esri:
- Get involved in our GeoNet community. This is a different kind of resource center where YOU can provide content as the user and have an opportunity to interact directly with Esri staff or other users, including technical "how-to" questions. This gives us at Esri an opportunity not only to listen TO you, but to ask YOU questions as well. See also this helpful video on Getting Started in a GeoNet community.
- Connect with our Government Teams which support NOAA, NASA, DOE, USGS, US Park Service, Census, EPA, USFW, USDA, etc., as well as natural resource agencies within state and local government agencies. See the Government Earth Sciences industry web site and brochure.
- Follow several of the Esri Open communities. These contains blog, Twitter streams, discussion forums, videos, case studies, maps, apps, data, and documentation, all of which contain significant content for the science community. Many of these resources are pre-selected to help users in a particular domain complete their work, without having to search through large volumes of content to find what best applies to that domain.
- Bookmark the Applied Analysis site to view various modes of analysis from exploration to decision-making as demonstrated by example, where workflows and processes are shown, results are interpreted, data and models can be downloaded.
- Bookmark the ArcGIS Pro web site, which has significant content for the science community, particularly with regard to geoprocessing and spatial analysis across many science domains.
- If you enjoy Twitter, follow Esri Chief Scientist Dawn Wright via @deepseadawn, where she makes science and ocean-related postings daily, as well as the @gisandscience Twitter account.
- Follow the GIS and Science blog of Matt Artz, to see the fascinating array of journal articles, books, and scholarly events where GIS technology is being used to advance scientific understanding.
- Attend the Esri International User Conference, where there are always high-quality paper sessions and map galleries focused on a wide array of scientific themes (including the annual GIScience Research or Frontiers in GIScience sessions and the new Science Symposium). In addition, there are Special Interest Group (SIG) meetings, and science-related demo theaters (e.g., demo theaters by the wizards in our Applications Prototype Lab are always a treat for scientists).
- Attend upcoming Esri specialist meetings with science themes (e.g., the Geodesign Summit, the Health and Human Services GIS Conference, the Ocean GIS Forum, the FedGIS Conference, etc.). Consider also the Esri Developer Summit. Information on all Esri events is available at esri.com/events.
- Esri staffers also do great science themselves, and you are welcome to visit our Zotero library showcasing our publications.
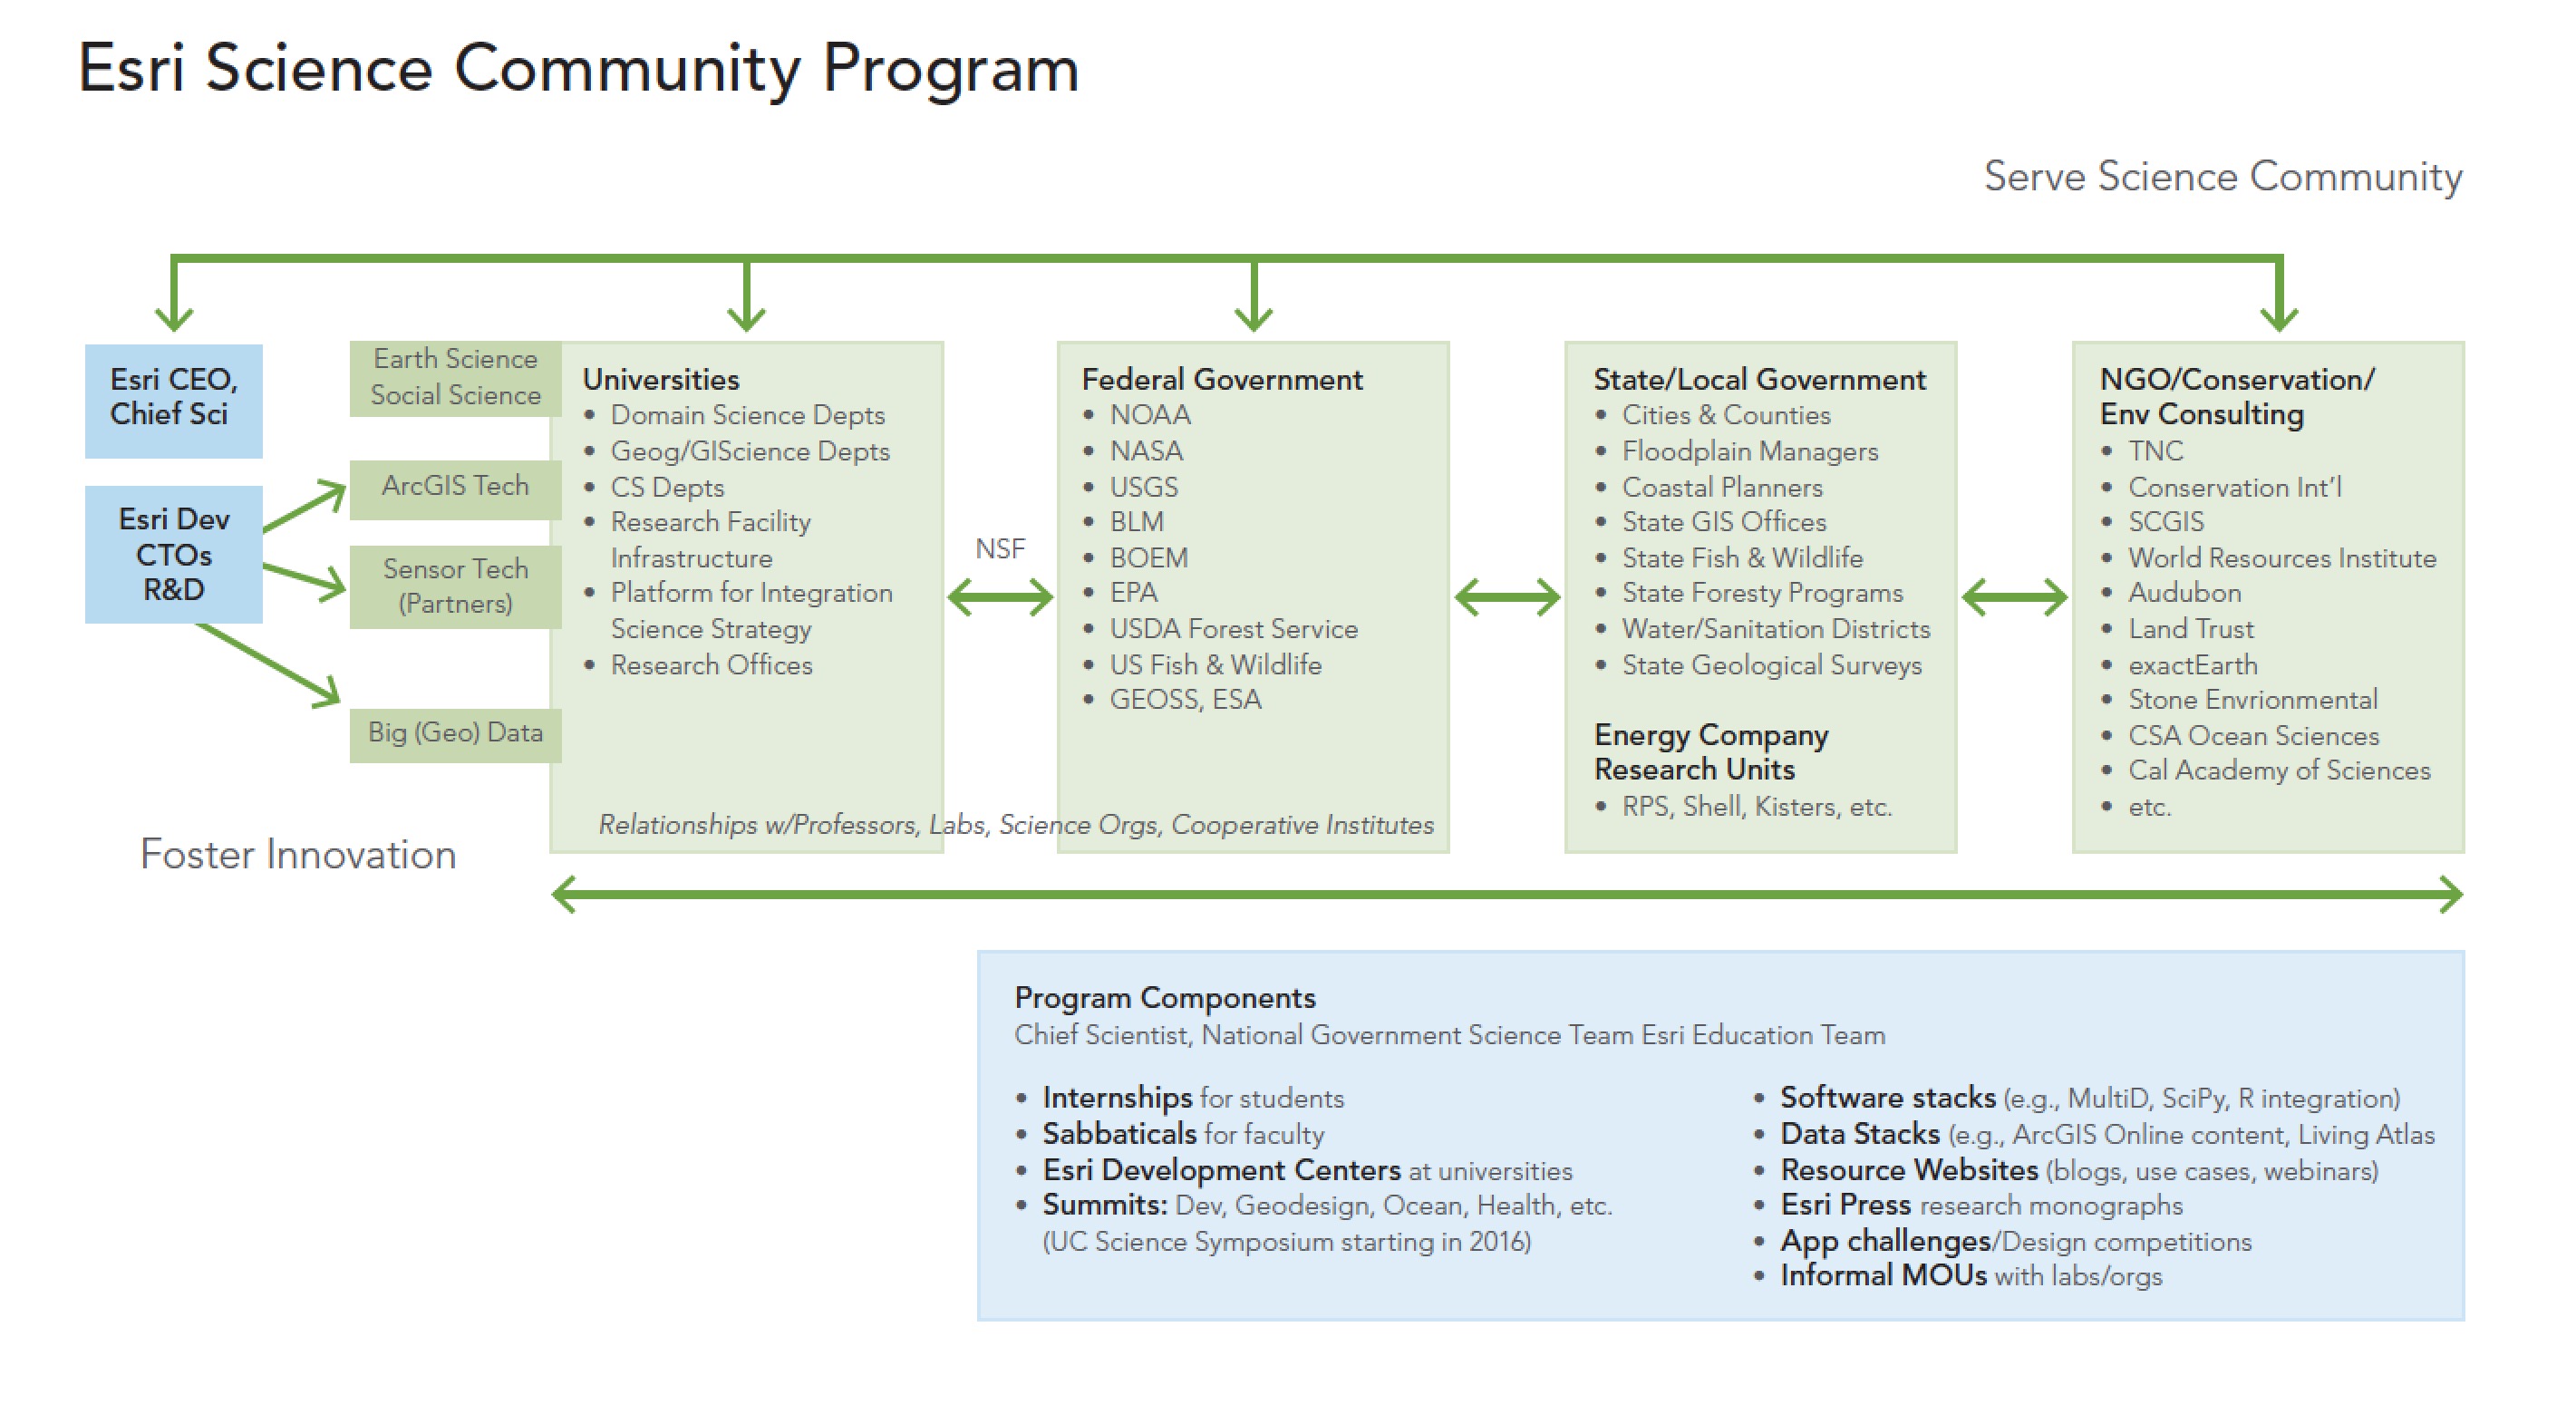
This diagram shows the various aspects of our comprehensive program to support the science community, showing the interlinkages between and among universities, government agencies, and various consultancies, nonprofits, for profits, and other organizations focused on science. Contact the Chief Scientist, Dawn Wright, dwright-at-esri.com, for more information.
- Tags:
- academic research
- academics
- citizen science
- climate
- earth resources observation and science
- earth science
- earth system science
- esri and the scientific community
- esri science
- esri science symposium
- geospatial data science
- gis research
- national government science
- ocean science
- open science
- research
- science toolkit
- sciences
- scientific community
- spatial data science
- the science of where
- weather
You must be a registered user to add a comment. If you've already registered, sign in. Otherwise, register and sign in.