- Home
- :
- All Communities
- :
- Industries
- :
- Transportation
- :
- Roads and Highways
- :
- Roads and Highways Blog
- :
- Python Script to ingest Waze data into ArcGIS Onli...
Python Script to ingest Waze data into ArcGIS Online
- Subscribe to RSS Feed
- Mark as New
- Mark as Read
- Bookmark
- Subscribe
- Printer Friendly Page
As part of the Waze Connected Citizen Program (CCP), partners gain access to real-time traffic congestions and incidents reported through the Waze app (in XML and JSON formats). There are already techniques and documentation on how to consume this data into an ArcGIS platform using GeoEvent.
In this blog, I will describe a technique for consuming this data into ArcGIS Online through Python and Windows Task Scheduler. The initial Python script was developed by Joel Meier which I modified to fit the workflow proposed. Also a special mention goes out to my colleagues Edmund Hall and Louis Tian who helped me debug. And last but not least I want to thank Andrew Stauffer for helping us parter and get the most out of Waze CCP.
Creating ArcGIS Online feature layers to store Traffic information
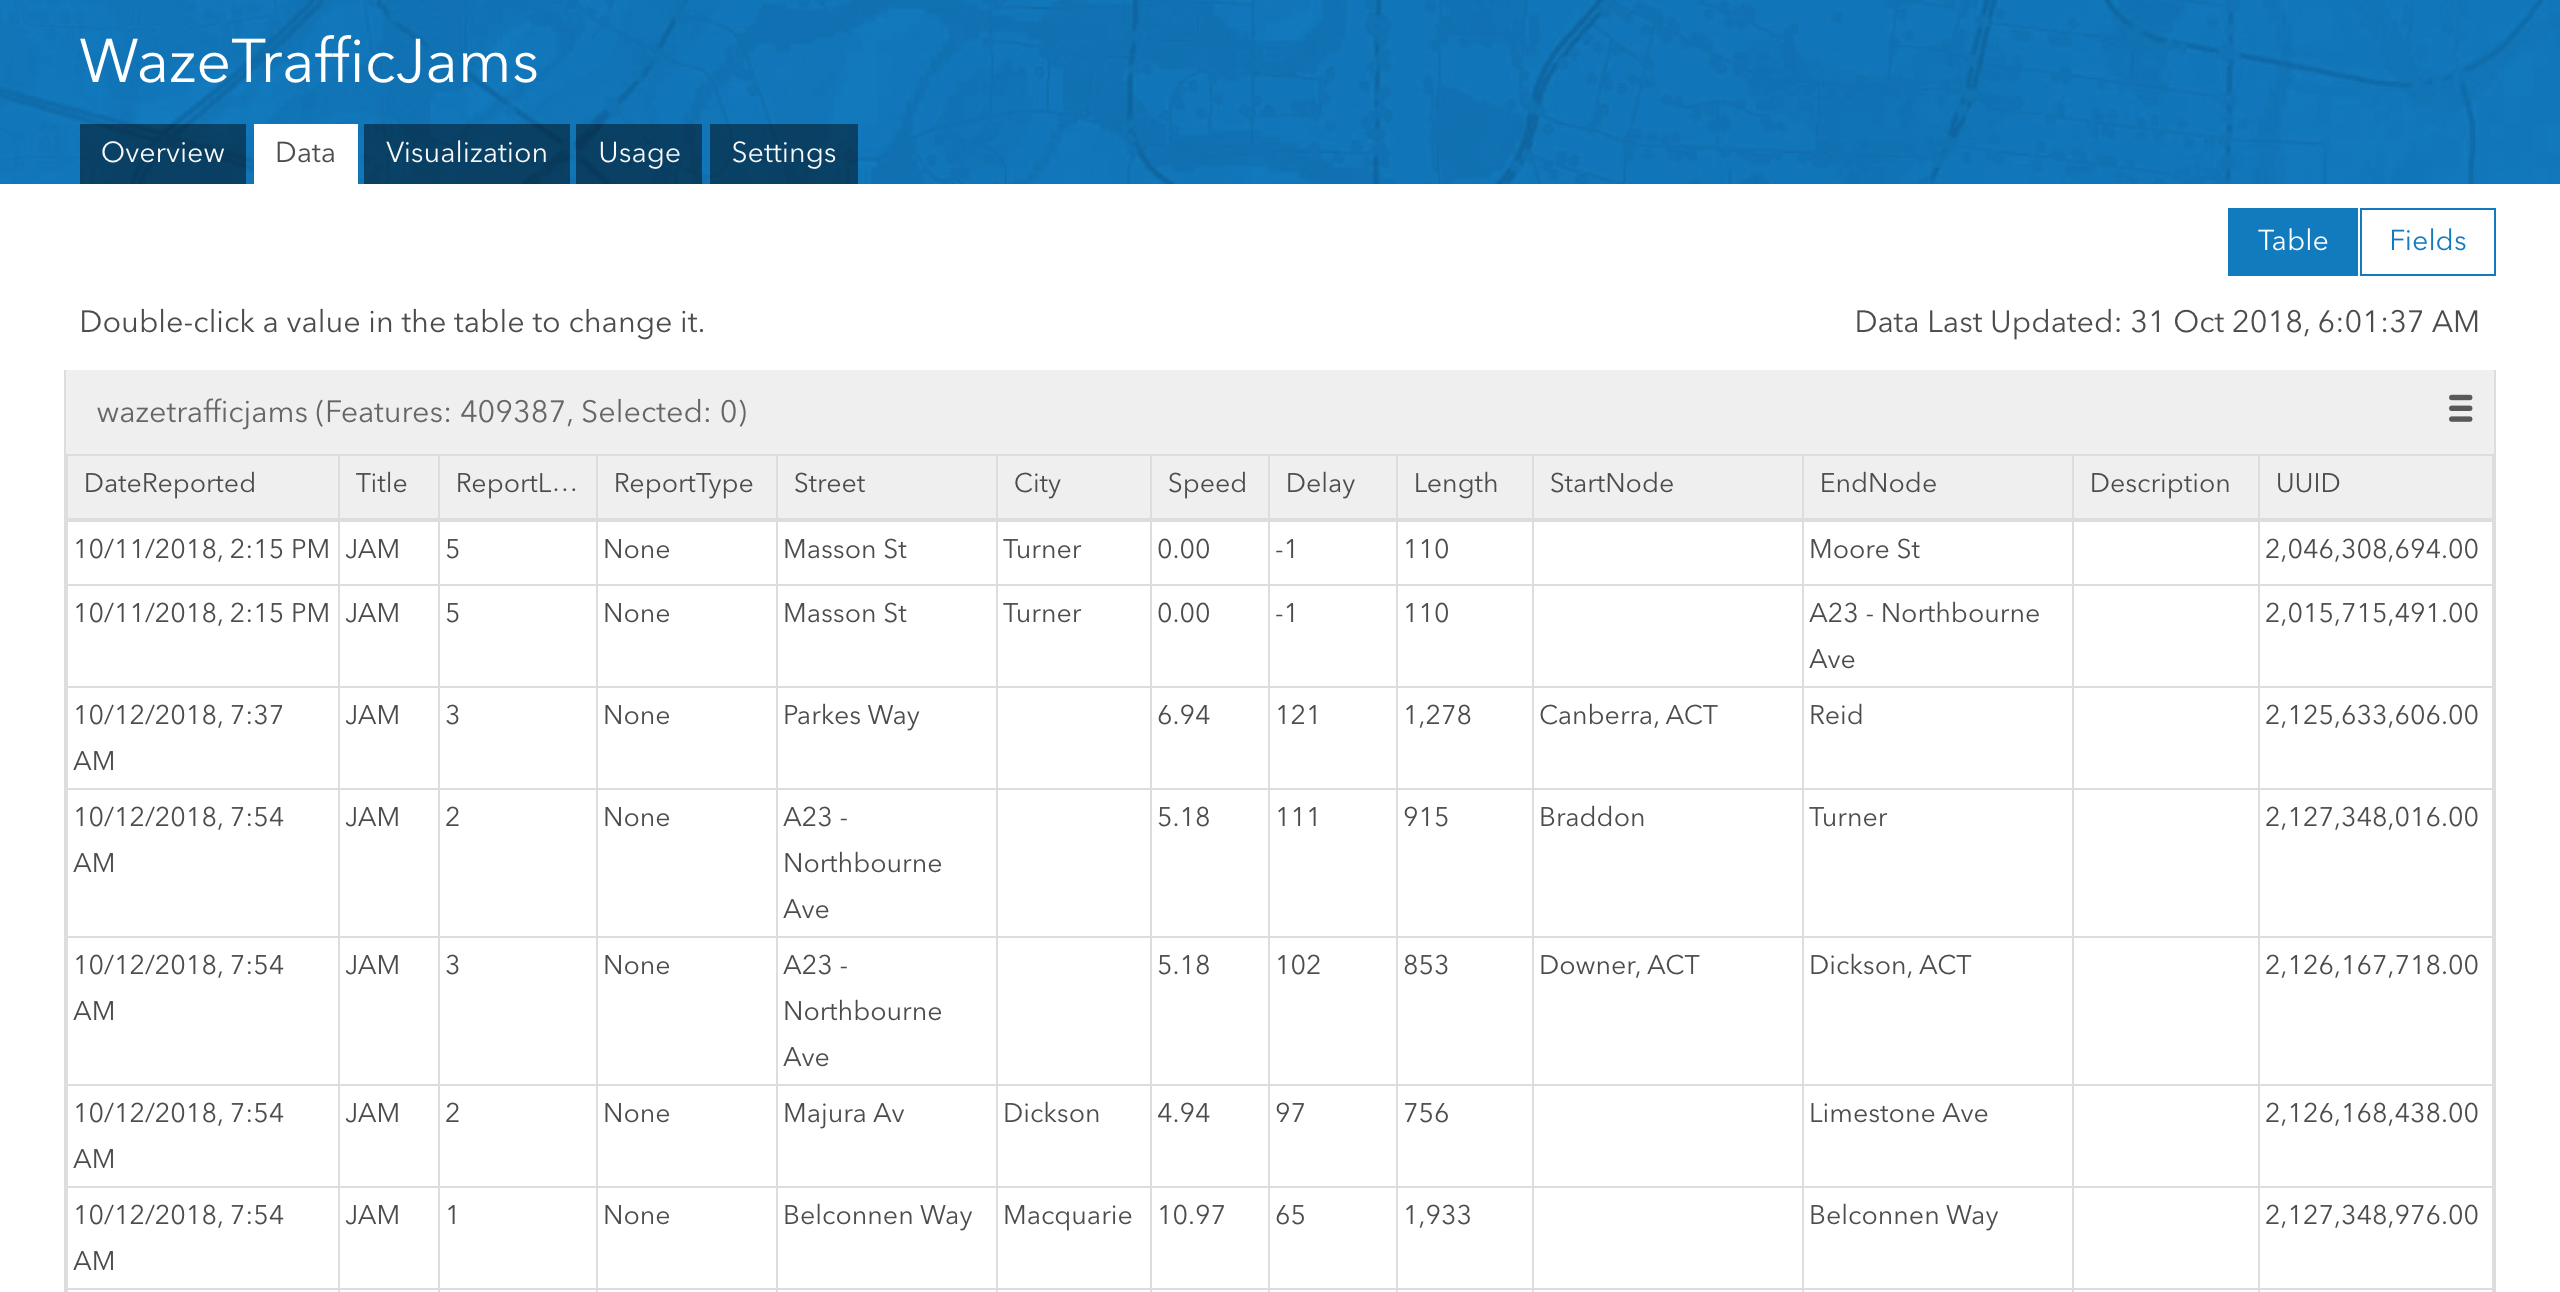
Sign into ArcGIS Online > My Content page, click Create > Feature Layer, choose From URL and enter the exact URL of the point feature layer template. Afterwards, repeat the same process for the line feature layer. This will create new empty feature layers of the schema required (field names, types and spatial reference).
Point Feature Layer Template
Line Feature Layer Template
Alternatively, visit https://developers.arcgis.com/layers/new to create Point and Line Geometry feature layers (WKID = 4326) with the following fields.

Point - Feature Layer
- OBJECTID (type: esriFieldTypeOID, alias: OBJECTID, SQL Type: sqlTypeOther, length: 0, nullable: false, editable: false)*
- DateReported (type: esriFieldTypeDate, alias: DateReported, SQL Type: sqlTypeTimestamp2, length: 0, nullable: true, editable: true)
- Title (type: esriFieldTypeString, alias: Title, SQL Type: sqlTypeOther, length: 25, nullable: true, editable: true)
- ReportType (type: esriFieldTypeString, alias: ReportType, SQL Type: sqlTypeOther, length: 25, nullable: true, editable: true)
- ReportSubtype (type: esriFieldTypeString, alias: ReportSubtype, SQL Type: sqlTypeOther, length: 50, nullable: true, editable: true)
- Street (type: esriFieldTypeString, alias: Street, SQL Type: sqlTypeOther, length: 256, nullable: true, editable: true)
- City (type: esriFieldTypeString, alias: City, SQL Type: sqlTypeOther, length: 50, nullable: true, editable: true)
- Description (type: esriFieldTypeString, alias: Description, SQL Type: sqlTypeOther, length: 1024, nullable: true, editable: true)
- Reliability (type: esriFieldTypeInteger, alias: Reliability, SQL Type: sqlTypeOther, nullable: true, editable: true)
- UUID (type: esriFieldTypeString, alias: UUID, SQL Type: sqlTypeOther, length: 100, nullable: true, editable: true)
- CreationDate (type: esriFieldTypeDate, alias: CreationDate, SQL Type: sqlTypeOther, length: 8, nullable: true, editable: false)*
- Creator (type: esriFieldTypeString, alias: Creator, SQL Type: sqlTypeOther, length: 128, nullable: true, editable: false)*
- EditDate (type: esriFieldTypeDate, alias: EditDate, SQL Type: sqlTypeOther, length: 8, nullable: true, editable: false)*
- Editor (type: esriFieldTypeString, alias: Editor, SQL Type: sqlTypeOther, length: 128, nullable: true, editable: false)*
*pre-populated fields
Line - Feature Layer
- OBJECTID (type: esriFieldTypeOID, alias: OBJECTID, SQL Type: sqlTypeOther, length: 0, nullable: false, editable: false)*
- DateReported (type: esriFieldTypeDate, alias: DateReported, SQL Type: sqlTypeTimestamp2, length: 0, nullable: true, editable: true)
- Title (type: esriFieldTypeString, alias: Title, SQL Type: sqlTypeOther, length: 25, nullable: true, editable: true)
- ReportLevel (type: esriFieldTypeInteger, alias: ReportLevel, SQL Type: sqlTypeOther, nullable: true, editable: true)
- ReportType (type: esriFieldTypeString, alias: ReportType, SQL Type: sqlTypeOther, length: 25, nullable: true, editable: true)
- Street (type: esriFieldTypeString, alias: Street, SQL Type: sqlTypeOther, length: 256, nullable: true, editable: true)
- City (type: esriFieldTypeString, alias: City, SQL Type: sqlTypeOther, length: 50, nullable: true, editable: true)
- Speed (type: esriFieldTypeDouble, alias: Speed, SQL Type: sqlTypeOther, nullable: true, editable: true)
- Delay (type: esriFieldTypeInteger, alias: Delay, SQL Type: sqlTypeOther, nullable: true, editable: true)
- Length (type: esriFieldTypeInteger, alias: Length, SQL Type: sqlTypeOther, nullable: true, editable: true)
- StartNode (type: esriFieldTypeString, alias: StartNode, SQL Type: sqlTypeOther, length: 256, nullable: true, editable: true)
- EndNode (type: esriFieldTypeString, alias: EndNode, SQL Type: sqlTypeOther, length: 256, nullable: true, editable: true)
- Description (type: esriFieldTypeString, alias: Description, SQL Type: sqlTypeOther, length: 1024, nullable: true, editable: true)
- UUID (type: esriFieldTypeDouble, alias: UUID, SQL Type: sqlTypeOther, nullable: true, editable: true)
- Shape__Length (type: esriFieldTypeDouble, alias: Shape__Length, SQL Type: sqlTypeDouble, nullable: true, editable: false)*
- CreationDate (type: esriFieldTypeDate, alias: CreationDate, SQL Type: sqlTypeOther, length: 8, nullable: true, editable: false)*
- Creator (type: esriFieldTypeString, alias: Creator, SQL Type: sqlTypeOther, length: 128, nullable: true, editable: false)*
- EditDate (type: esriFieldTypeDate, alias: EditDate, SQL Type: sqlTypeOther, length: 8, nullable: true, editable: false)*
- Editor (type: esriFieldTypeString, alias: Editor, SQL Type: sqlTypeOther, length: 128, nullable: true, editable: false)*
*pre-populated fields
Please make sure to use the exact field names and types, (alternatively you'd have to adjust the script).
Once feature layers are configured, please enable editing and set them to PRIVATE.
Please refer to "Waze Feed Technical Specifications [Get Waze Data]" from the Partner's Portal for exact definitions on field descriptions.
Configuring the Python script
Replace the comment sections (lines 6, 9 and 10) with your own XML feed, and URLs for your point and line feature layers.
import xml.etree.ElementTree as ET
import urllib.request
import arcpy
from datetime import datetime
namespaces = {'georss' : 'http://www.georss.org/georss', 'linqmap':'http://www.linqmap.com' }
tree = ET.ElementTree(file=urllib.request.urlopen('##URL for XML waze connection##'))
root = tree.getroot()
channel_head = []
fcp = "##URL to Point - Feature Layer##"
fcl = "##URL to Line - Feature Layer##"
for member in root.findall('channel/item'):
channel = []
Title = member.find('title').text.upper()
try:
point = member.find('georss:point', namespaces)
line = member.find('georss:line', namespaces)
except:
pass
print('Fail Stage 0')
if point != None:
try:
Date = member.find('pubDate').text
DateReported = datetime.strptime(Date, '%a %b %d %H:%M:%S %z %Y')
if len(member.findall('linqmap:city', namespaces)) > 0:
City = member.find('linqmap:city', namespaces).text
else:
City = ''
if len(member.findall('linqmap:street', namespaces)) > 0:
Street = member.find('linqmap:street', namespaces).text
else:
Street = ''
if len(member.findall('linqmap:subtype', namespaces)) > 0 and member.find('linqmap:subtype', namespaces).text is not None:
Subtype = member.find('linqmap:subtype', namespaces).text.replace('_', ' ').capitalize()
else:
Subtype = ''
UUID = member.find('linqmap:uuid', namespaces).text
Reliability = member.find('linqmap:reliability', namespaces).text
if len(member.findall('linqmap:reportDescription', namespaces)) > 0:
Description = member.find('linqmap:reportDescription', namespaces).text
else:
Description = ''
Type = member.find('linqmap:type', namespaces).text.replace('_', ' ').capitalize()
point = member.find('georss:point', namespaces).text.replace(' -',',-').split(' ')
row = Subtype, Type, Title, DateReported, City, Street, UUID, Reliability, Description, float(point[1]),float(point[0])
cursor = arcpy.da.InsertCursor(fcp, ["ReportSubtype","ReportType","Title","DateReported","City","Street","UUID","Reliability","Description","SHAPE@X","SHAPE@Y"])
cursor.insertRow(row)
del cursor
print('stage 1')
except:
pass
print('fail Stage 1')
elif line != None:
if Title != 'IRREGULARITY':
try:
Date = member.find('pubDate').text
DateReported = datetime.strptime(Date, '%a %b %d %H:%M:%S %z %Y')
if len(member.findall('linqmap:city', namespaces)) > 0:
City = member.find('linqmap:city', namespaces).text
else:
City = ''
if len(member.findall('linqmap:startNode', namespaces)) > 0:
StartNode = member.find('linqmap:startNode', namespaces).text
else:
StartNode = ''
if len(member.findall('linqmap:endNode', namespaces)) > 0:
EndNode = member.find('linqmap:endNode', namespaces).text
else:
EndNode = ''
if len(member.findall('linqmap:reportDescription', namespaces)) > 0:
Description = member.find('linqmap:reportDescription', namespaces).text
else:
Description = ''
if len(member.findall('linqmap:street', namespaces)) > 0:
Street = member.find('linqmap:street', namespaces).text
else:
Street = ''
UUID = member.find('linqmap:uuid', namespaces).text
Type = member.find('linqmap:type', namespaces).text.replace('_', ' ').capitalize()
Length = member.find('linqmap:length', namespaces).text
Level = member.find('linqmap:level', namespaces).text
line = member.find('georss:line', namespaces).text.replace('\n', '').replace(' ', '],[').replace('],[-',', -').split(', ')
Speed = member.find('linqmap:speed', namespaces).text
Delay = member.find('linqmap:delay', namespaces).text
cur = arcpy.da.InsertCursor(fcl, ["Speed","Delay","Title","ReportType","DateReported","City","Street","Length","ReportLevel","UUID","StartNode","EndNode","Description","SHAPE@"])
array = arcpy.Array()
for coords in line:
xy = coords.split('],[')
array.add(arcpy.Point(xy[1], xy[0]))
cur.insertRow([Speed,Delay,Title,Type,DateReported,City,Street,Length,Level,UUID,StartNode,EndNode,Description,arcpy.Polyline(array)])
del cur
print('stage 2')
except:
pass
print('fail Stage 2')
else:
try:
Date = member.find('updateDate').text
DateReported = datetime.strptime(Date, '%a %b %d %H:%M:%S %z %Y')
if len(member.findall('linqmap:city', namespaces)) > 0:
City = member.find('linqmap:city', namespaces).text
else:
City = ''
if len(member.findall('linqmap:startNode', namespaces)) > 0:
StartNode = member.find('linqmap:startNode', namespaces).text
else:
StartNode = ''
if len(member.findall('linqmap:endNode', namespaces)) > 0:
EndNode = member.find('linqmap:endNode', namespaces).text
else:
EndNode = ''
if len(member.findall('linqmap:reportDescription', namespaces)) > 0:
Description = member.find('linqmap:reportDescription', namespaces).text
else:
Description = ''
if len(member.findall('linqmap:street', namespaces)) > 0:
Street = member.find('linqmap:street', namespaces).text
else:
Street = ''
UUID = member.find('linqmap:id', namespaces).text
Type = member.find('linqmap:type', namespaces).text.replace('_', ' ').capitalize()
Length = member.find('linqmap:length', namespaces).text
Level = member.find('linqmap:trend', namespaces).text
line = member.find('georss:line', namespaces).text.replace('\n', '').replace(' ', '],[').replace('],[-',', -').split(', ')
Speed = member.find('linqmap:speed', namespaces).text
Delay = member.find('linqmap:delaySeconds', namespaces).text
cur = arcpy.da.InsertCursor(fcl, ["Speed","Delay","Title","ReportType","DateReported","City","Street","Length","ReportLevel","UUID","StartNode","EndNode","Description","SHAPE@"])
array = arcpy.Array()
for coords in line:
xy = coords.split('],[')
array.add(arcpy.Point(xy[1], xy[0]))
cur.insertRow([Speed,Delay,Title,Type,DateReported,City,Street,Length,Level,UUID,StartNode,EndNode,Description,arcpy.Polyline(array)])
del cur
print('stage 3')
except:
pass
print('fail Stage 3')
else:
print('Error')Scheduling the script
Once the Python script is up and running use Windows Task Scheduler to run the script at specific time intervals which will append new features to the ArcGIS Online feature layers (this technique will keep a history of all traffic information from when you first run the script).

Displaying Live Traffic Information
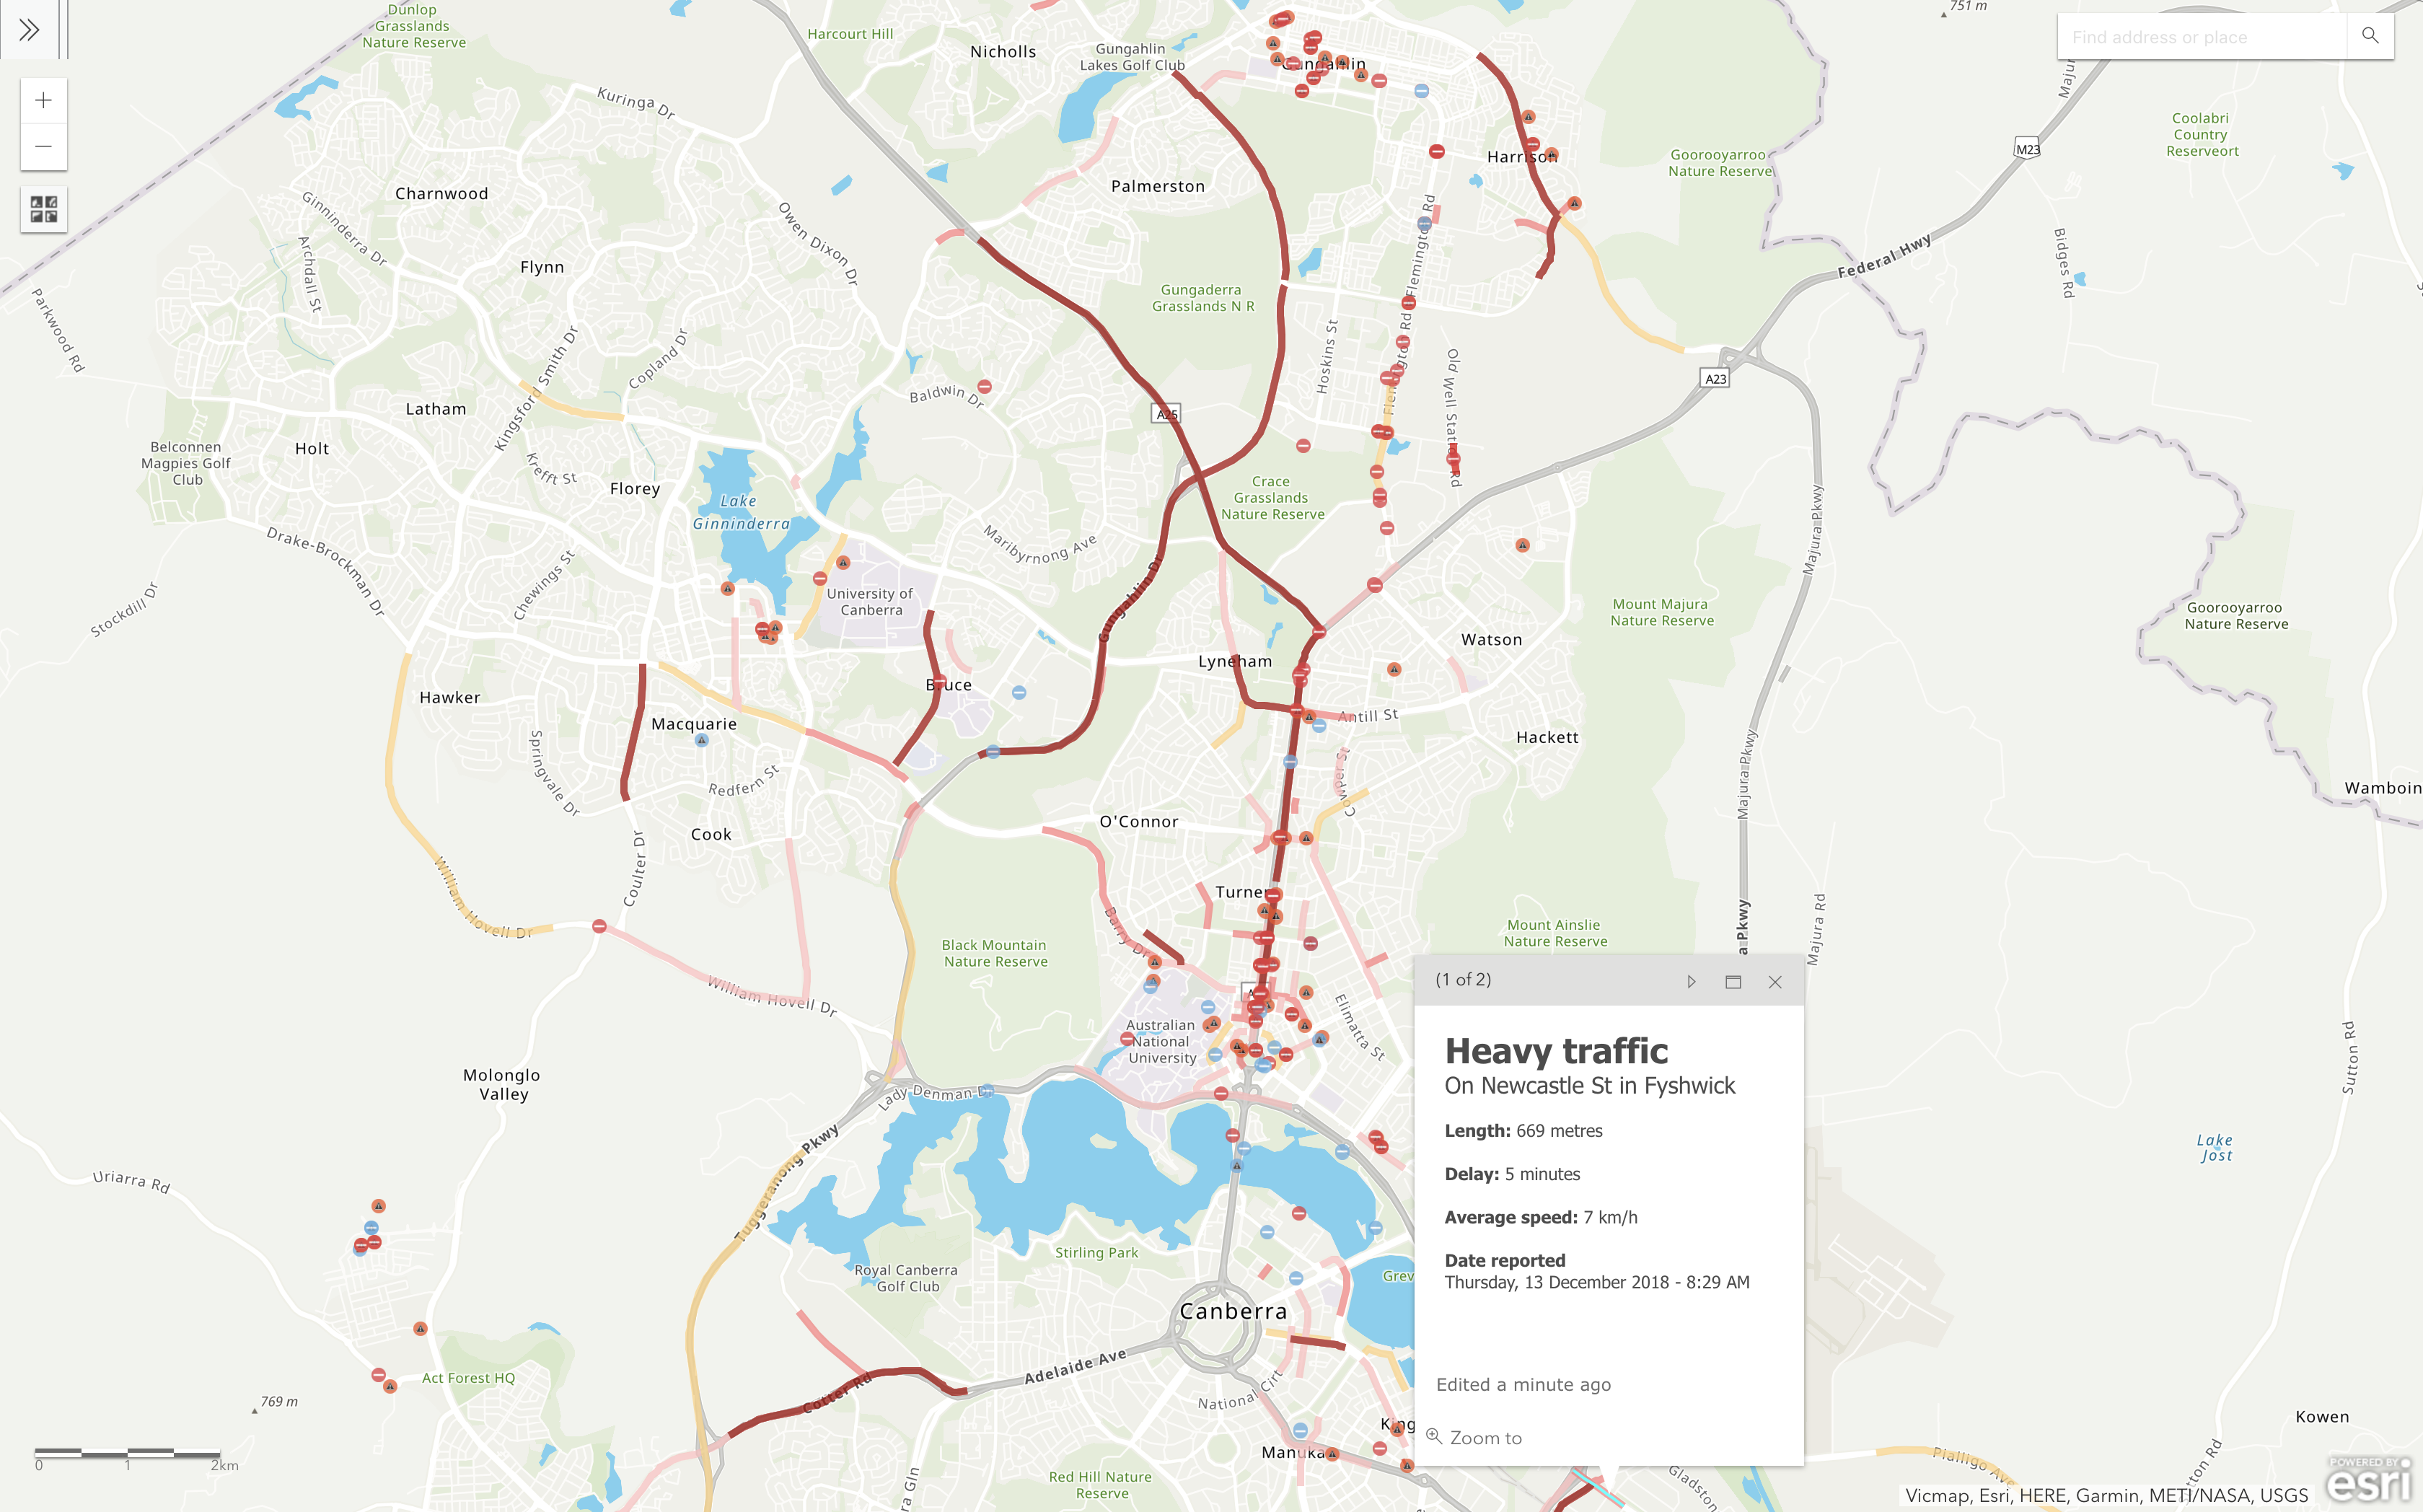
To display live traffic information - create feature layer views and define its features to only show features created in the last x number of minutes - x being how frequently you've setup the Python script to run.
I've setup the Python script to run every 4 minutes - subsequently the feature layer views to display features created in the last 4 minutes.

Once setup, you can share these views publicly and display it on public facing applications.
Below are links to our feature layer views, and a map displaying these features alongside road/footpath closures.
*click here to find out more about our road/footpath work application process
Email specific people when an Accident is reported
I used the following method, alternatively you could use similar Python scripts or create your own Python script to trigger an email when new features are added to a feature layer.
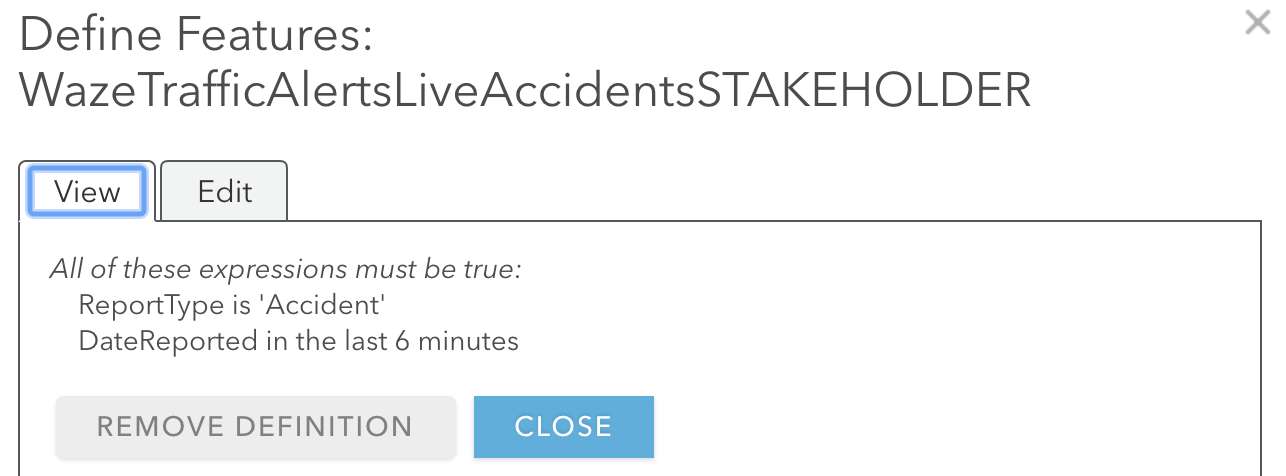
Run the email script of your choice on a new feature layer view (geometry type = point) that only displays Accidents (ReportType = "Accident"), where DateReported was in the last x number of minutes.

And finally, setup windows task scheduler to capture any new features (accidents) that occur in the last x number of minutes.
I hope you can leverage these workflows to fit your own business needs. And please feel free to share your thoughts, comments or questions in the comments section below.
Cheers! - Gee Fernando
You must be a registered user to add a comment. If you've already registered, sign in. Otherwise, register and sign in.
