- Home
- :
- All Communities
- :
- Developers
- :
- Python
- :
- Python Questions
- :
- Which statistical library
- Subscribe to RSS Feed
- Mark Topic as New
- Mark Topic as Read
- Float this Topic for Current User
- Bookmark
- Subscribe
- Mute
- Printer Friendly Page
Which statistical library
- Mark as New
- Bookmark
- Subscribe
- Mute
- Subscribe to RSS Feed
- Permalink
I'd like opinions, no code necessary, on libraries for performing basic descriptive stats using the python tools that ship in the box with an ArcGIS 10.3 standard licence (so Python 2.7). I'm behind a corporate firewall with no ability to install any additional libraries.
I'm not planning in doing ML or predictive analytics just yet. I have a simple requirement to :
- get simple aggregates (counts, count not null, count grouping by)
- measures of central tendency (mean, mode, median, range, variance & standard deviation)
- box plots, histograms and pie charts
- output results to XLS
Inputs would be file GDB feature classes ranging in volume from 5 records to 5 million records, with most under 1 million records. Execution would be infrequent, maybe once or twice a day to assist with generic data profiling. I'm not hooking this up to a high volume web service, so speed is not critical. The ability to write clear code is.
I suspect I could achieve my requirements with one or more of:
- arcpy.da.SearchCursor (yeah, the long way 'round)
- arcpy.Statistics_analysis
- scipy.stats
- numpy
- pandas
- sqllite
- mapplotlib
- xlwt
Getting into one or more of these will be a time investment that I'd hope to still be useful when I (hope) I will be able to upgrade to ArcGIS 10.6 and 'Pro with Python 3.6 in the next year.
So, which do you think are worth learning for this purpose?
- Mark as New
- Bookmark
- Subscribe
- Mute
- Subscribe to RSS Feed
- Permalink
I really like working with Pandas, I find it very intuitive to learn and powerful. I also use numpy as required but it is has a much steeper learning curve. Pandas has great grouping and aggregating functions that should make it easy to do aggregations and summary statistics. The pandas dataframe has some built in basic plotting but matplotlib allows for a lot more customization.
I use a search cursor to pull all the data into a pandas data frame. I don't think you will run into any memory limits based on the size of file you described.
import arcpy
import pandas as pd
fields_list = ['field1', 'field2']
input_fc = r'c:\temp\temp.gdb\input_fc'
feature_data = []
with arcpy.da.SearchCursor(input_fc, fields_list) as cursor:
for row in cursor:
feature_data.append(list(row))
df = pd.DataFrame(feature_data, columns=fields_list)- Mark as New
- Bookmark
- Subscribe
- Mute
- Subscribe to RSS Feed
- Permalink
Of course there are similar shortcuts in numpy like skipping the searchcursor and pulling out the data directly from a featureclass.
It is pretty speedy and there are functions (nan functions) that account for nodata/null values in the data.
For example
import numpy
import arcpy
fc = r"C:\GIS\A_Tools_scripts\Table_tools\Table_tools.gdb\pnts_2K_normal"
fields = ['C_0', 'C_1']
a = arcpy.da.TableToNumPyArray(fc, fields)
a.size
2000
np.nanmean(a['C_0']) # account for nulls aka missing data
10.520978947368421Then you can graph (simple ones using matplotlib)
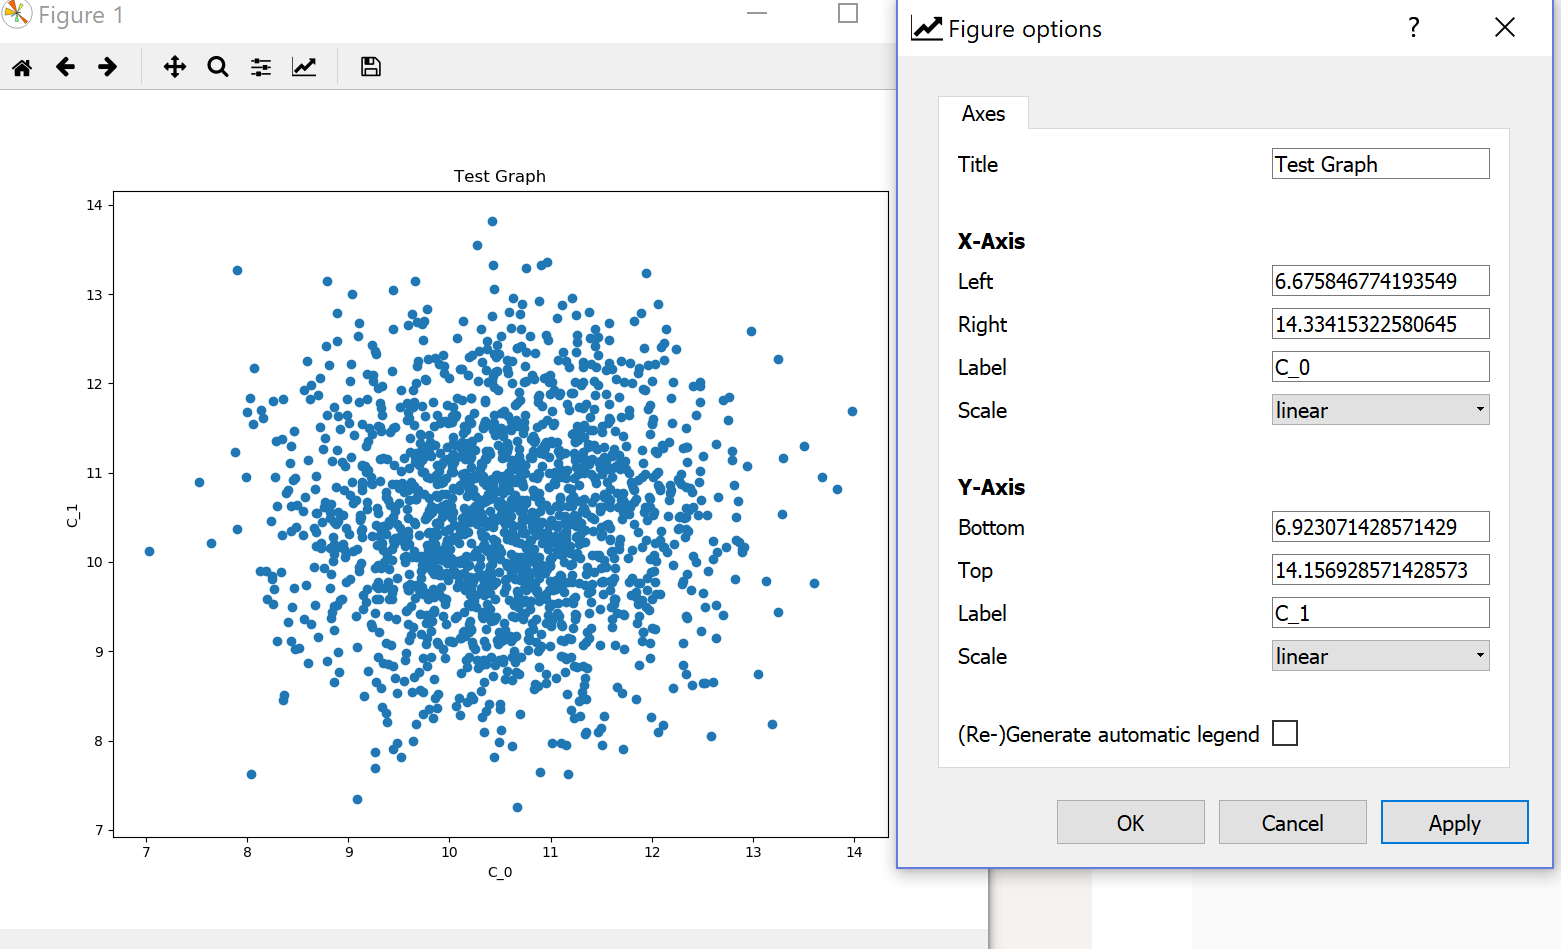
import matplotlib.pyplot as plt
plt.scatter(a['C_0'], a['C_1'])
<matplotlib.collections.PathCollection object at 0x0000025D3C94C2E8>If you are using Spyder (a python IDE... see my blogs), you can do interactive graphing once you have the basic plot and you don't even need to code since you can fancy the plots directly
So numpy and matplotlib are pretty simple to use... I have tons of examples on my blog (just check my user name on GeoNet)
Have fun
- « Previous
-
- 1
- 2
- Next »
- « Previous
-
- 1
- 2
- Next »