- Home
- :
- All Communities
- :
- Developers
- :
- Python
- :
- Python Questions
- :
- What is the fastest way to iterate through Street ...
- Subscribe to RSS Feed
- Mark Topic as New
- Mark Topic as Read
- Float this Topic for Current User
- Bookmark
- Subscribe
- Mute
- Printer Friendly Page
What is the fastest way to iterate through Street data to fix Address Range issues?
- Mark as New
- Bookmark
- Subscribe
- Mute
- Subscribe to RSS Feed
- Permalink
I have 5 types of issues with address ranges, due to irregularities in how the local communities assigned civic addresses. These include odds and evens on the same side of the street, the "high" end of the range actually being lower than the "low end of the range (due to digitizing direction, in relation to traffic flow direction), or all of the addresses on both sides being odd or being even in the case of a cul-de-sac. For some of these cases, I need to find the connected segments of the road that have the same street name, zero their ranges, and put the entire range onto one segment to solve the issue.
I need to export my street data for use by others, and their software doesn't tolerate any of these oddities, so we have to massage the data to make it work, by adjusting the ranges so that they comply with the rules: "odds on one side, evens on the other" and "low to high" in the digitizing direction.
We have a tool written by others in .NET/ArcObjects which can process the entire dataset (>60000 roads) in about a minute or two. (There are only about 110 roads with issues). But the existing tool has deficiencies that we want to correct and we don't have access to the original source code. The fastest I've been able to manage is about 30 minutes to loop through the data in python using selection sets and cursors.
I'm trying to figure out how the author of the other tool did it so much faster. Any ideas? I'm wondering if I would have better luck loading all of the attribute data into python dictionaries and processing it in memory and writing all the changes back at the end, rather than using a cursor to loop through the data directly.
I don't want to influence replies by posting my code - I want to abandon my method and find some alternate method that is significantly faster. So can anyone think of a way to do it in only 2 minutes?
- Mark as New
- Bookmark
- Subscribe
- Mute
- Subscribe to RSS Feed
- Permalink
Hi, see if this sample works for you - it is a bit old now, but should function:
- Mark as New
- Bookmark
- Subscribe
- Mute
- Subscribe to RSS Feed
- Permalink
I'll try it out, thanks.
- Mark as New
- Bookmark
- Subscribe
- Mute
- Subscribe to RSS Feed
- Permalink
Your tool requires a street_id separate from the segment_id - our dataset doesn't have that. I wish it did, that would have made one part of my process much simpler.
I also can't see the source code as it is a compiled tbx, which doesn't teach me anything python-wise.
- Mark as New
- Bookmark
- Subscribe
- Mute
- Subscribe to RSS Feed
- Permalink
You can see the code, just right click on the tool in the toolbox and edit.
The code is embedded, not passworded.
- Mark as New
- Bookmark
- Subscribe
- Mute
- Subscribe to RSS Feed
- Permalink
thanks. I usually work in python toolboxes (.pyt) rather than regular toolboxes (.tbx), and never bothered figuring out how to embed code that way.
- Mark as New
- Bookmark
- Subscribe
- Mute
- Subscribe to RSS Feed
- Permalink
I replaced the download with external source.
- Mark as New
- Bookmark
- Subscribe
- Mute
- Subscribe to RSS Feed
- Permalink
Ok, your code gave me a few ideas. I think I might be able to handle some of the more complex cases by dissolving, doing some statistics on the dissolve, and handing the results of those back to the main dataset. Whether or not this will be faster remains to be seen, but it's far fewer commands so it really can't be slower I don't think. Unfortunately it doesn't solve all the cases, but its a start.
- Mark as New
- Bookmark
- Subscribe
- Mute
- Subscribe to RSS Feed
- Permalink
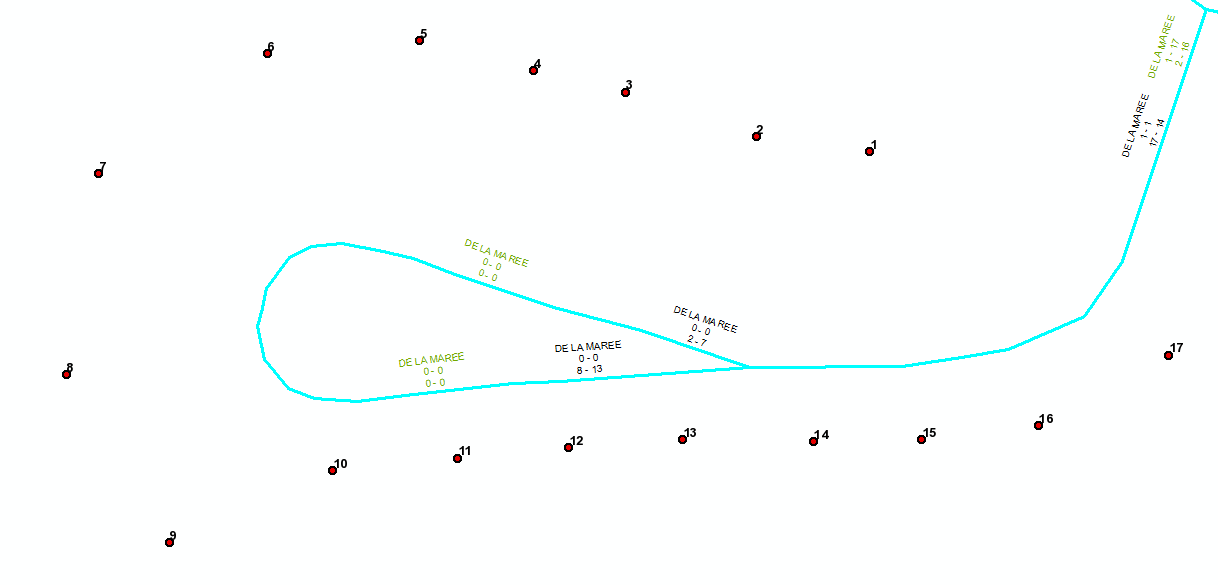
In this example the black labels represent the ranges in the main dataset on the server, and the green labels represent what I'm trying to get to. How can I programatically determine that I want to apply the range to the segment on the right, rather than one of the two on the left?
- Mark as New
- Bookmark
- Subscribe
- Mute
- Subscribe to RSS Feed
- Permalink
Without seeing your code it's tough to know how to make it run faster. I know that arcpy does involve a certain amount of abstraction and therefore isn't always the fastest when compared to .NET solutions. I have a more generic python/arcpy QAQC process that rips through large datasets fairly quickly.
A couple questions/considerations:
1. Are you using data access module cursors, or the old kind?
2. What is the format of your streets data?
3. Are you processing it over a network or locally?
4. Are you importing a bunch of modules or packages that you aren't using?
5. Slightly facetious one: 30 minutes doesn't seem too bad. Why not just run it over lunch?
Micah