- Home
- :
- All Communities
- :
- Developers
- :
- Python
- :
- Python Questions
- :
- Re: Reformating data in a feature class/table
- Subscribe to RSS Feed
- Mark Topic as New
- Mark Topic as Read
- Float this Topic for Current User
- Bookmark
- Subscribe
- Mute
- Printer Friendly Page
- Mark as New
- Bookmark
- Subscribe
- Mute
- Subscribe to RSS Feed
- Permalink
I received a feature class that is currently in the format, illustrated below..
| AREA | POPUNDER20 | POPOVER20 | POPOVER50 |
|---|---|---|---|
| TAMPA | 1000 | ||
| TAMPA | 2000 | ||
| MIAMI | 500 | ||
| MIAMI | 1000 | ||
| MIAMI | 3000 | ||
| MONTREAL | 4000 | ||
| MONTREAL | 5000 |
I would be needing to re-format this feature class to:
| AREA | POPUNDER20 | POPOVER20 | POPOVER50 |
|---|---|---|---|
| TAMPA | 1000 | 2000 | |
| MIAMI | 500 | 1000 | 3000 |
| MONTREAL | 4000 | 5000 |
If anyone could recommened a script or a tool that would help reformat, that would be really helpful
thanks in advance.
Solved! Go to Solution.
Accepted Solutions
- Mark as New
- Bookmark
- Subscribe
- Mute
- Subscribe to RSS Feed
- Permalink
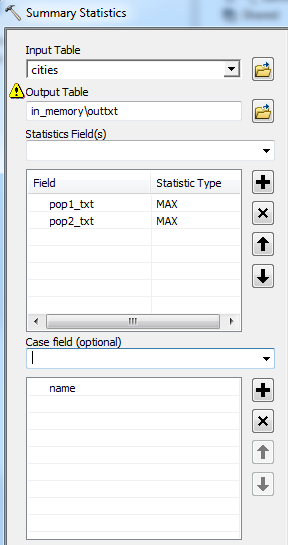
Hmmm... it works for me. Use MAX as the statistic type for each of the pop fields and AREA (the city names) for the case field. MAX should work regardless of whether it's a text or numerical field.
If that doesn't work, how does it not work? Error, blank output, wrong output?
1.)

2.)
3.)

- Mark as New
- Bookmark
- Subscribe
- Mute
- Subscribe to RSS Feed
- Permalink
You could use Summarizing data in a table—Help | ArcGIS for Desktop
- Mark as New
- Bookmark
- Subscribe
- Mute
- Subscribe to RSS Feed
- Permalink
Summary Statistics, using AREA as case field and the other fields as statistics fields should do the trick.
- Mark as New
- Bookmark
- Subscribe
- Mute
- Subscribe to RSS Feed
- Permalink
Does not work. What statistic type would you assign to the other fields, anyway?
- Mark as New
- Bookmark
- Subscribe
- Mute
- Subscribe to RSS Feed
- Permalink
Hmmm... it works for me. Use MAX as the statistic type for each of the pop fields and AREA (the city names) for the case field. MAX should work regardless of whether it's a text or numerical field.
If that doesn't work, how does it not work? Error, blank output, wrong output?
1.)
2.)
3.)
- Mark as New
- Bookmark
- Subscribe
- Mute
- Subscribe to RSS Feed
- Permalink
Darren, changing the type to MAX does work. Thank you so much.