- Home
- :
- All Communities
- :
- Developers
- :
- Python
- :
- Python Questions
- :
- Re: Pivot: Zonal Histogram Results Table
- Subscribe to RSS Feed
- Mark Topic as New
- Mark Topic as Read
- Float this Topic for Current User
- Bookmark
- Subscribe
- Mute
- Printer Friendly Page
Pivot: Zonal Histogram Results Table
- Mark as New
- Bookmark
- Subscribe
- Mute
- Subscribe to RSS Feed
- Permalink
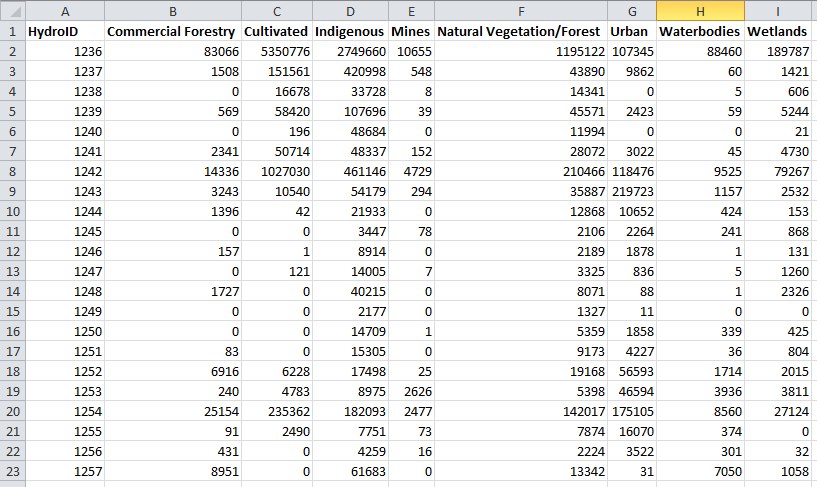
I'm busy summarizing the landuse found within each of my watersheds using Zonal Histogram. I'd like to pivot the Hydro (i.e. Hydro_1236 etc.) columns to rows and pivot the Label Column values to column headings. I've attached the Zonal Histogram Results Table as well as a mock-up of the table structure that I'm looking for.
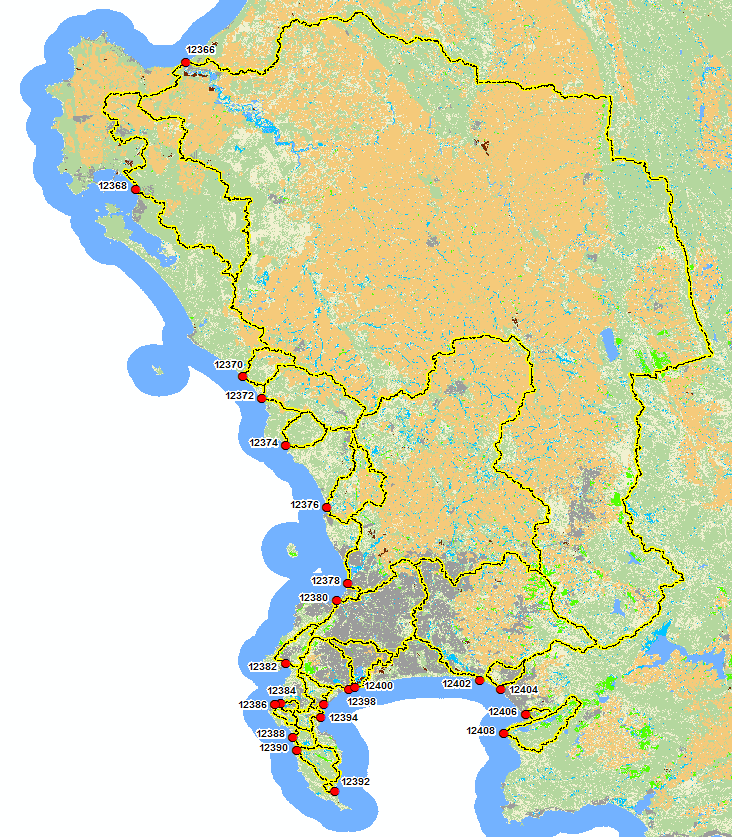
Watersheds + Land-use Raster
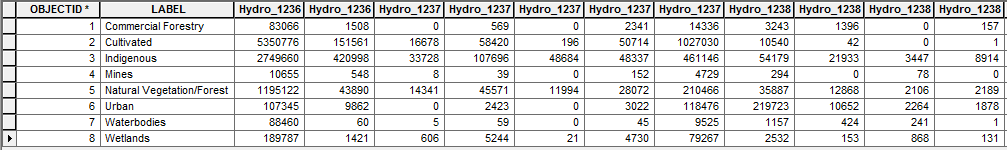
Zonal Histogram Results Table
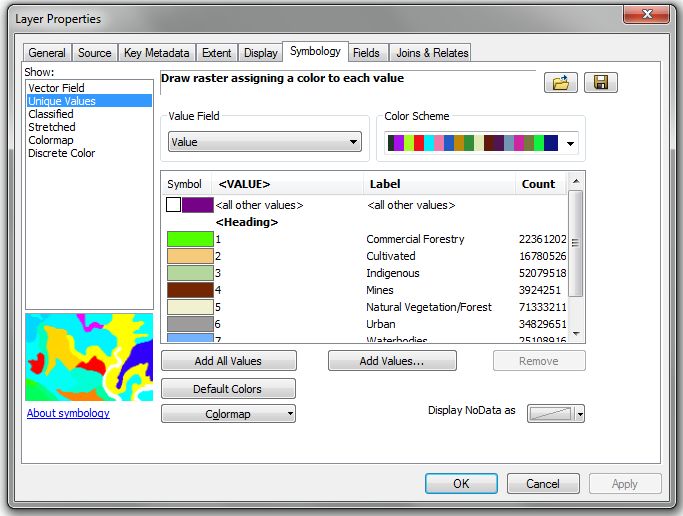
Landuse Raster: Classification
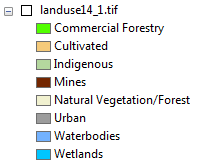
Landuse Raster: Labels
Pivot Results Table:
Note that the HydroID field values were based on the following fields: Hydro_1236 etc. I removed "Hydro_" before adding them to the HydroID field.
How can I achieve the following using either Python Pivot Table or Pandas, thanks in advance for any help on the following.
- Mark as New
- Bookmark
- Subscribe
- Mute
- Subscribe to RSS Feed
- Permalink
Peter... if it just to facilitate flopping back and forth between rows and column primes, then you can just create an 'object' array by whipping in an extra row of column headers into your array structure then use the dtype object.
Note... this is a quick and dirty solution and just for the purposes designated, if you want to do any 'work' with the file, then ignore me
>>> a = [["-","a","b","d","e"],["A",1,2,3,4],["B",5,6,7,8],["C",1,3,5,7]]
>>> a0 = np.asarray(a,dtype='object')
>>> a1 = a0.T
>>> a1
array([['-', 'A', 'B', 'C'],
      ['a', 1, 5, 1],
      ['b', 2, 6, 3],
      ['d', 3, 7, 5],
      ['e', 4, 8, 7]], dtype=object)
>>> a0
array([['-', 'a', 'b', 'd', 'e'],
      ['A', 1, 2, 3, 4],
      ['B', 5, 6, 7, 8],
      ['C', 1, 3, 5, 7]], dtype=object)
- Mark as New
- Bookmark
- Subscribe
- Mute
- Subscribe to RSS Feed
- Permalink
HI Dan
Apologies that I never got back to you sooner, as I've been off sick. Why can't you Pivot\Transpose a Structured Array? I have to forgo using TableToNumPyArray and use a SearchCursor to build a Python list from my Zonal Histogram table results. I've achieved the pivoted results that I was looking for, but now need assistance getting the following back into a Structured Array so that I can use NumPyArrayToTable:
'''
Created on 06 Jul 2016

Zonal Histogram:

Pivot Results Table

@author: PeterW
'''
# import site-packages and modules
import numpy as np
import arcpy

# set arguments
hist_table = r"E:\Projects\2016\G112669\Calcs.gdb\ftr_watersheds_lu_stats_160706"
output_pivot = r"E:\Projects\2016\G112669\Calcs.gdb\ftr_watersheds_lu_pivot_160712"

# set environment settings
arcpy.env.overwriteOutput = True


# pivot zonal histogram results table
def hist_pivot(hist_table, output_pivot):
    sum_list = []
    fields = [f.name for f in arcpy.ListFields(hist_table)[1:]]
    fields_pivot = ["HydroID" if x == "LABEL" else int(x.replace("Hydro_", "")) for x in fields]
    sum_list.append(fields_pivot)
    with arcpy.da.SearchCursor(hist_table, fields) as scur:# @UndefinedVariable
        for row in scur:
            sum_list.append(list(row))
    arr = np.asarray(sum_list, dtype="object")
    arr_pivot = arr.T
    print(arr_pivot)
#     arcpy.da.NumPyArrayToTable(arr_pivot, output_pivot)# @UndefinedVariable

hist_pivot(hist_table, output_pivot)
Python Code
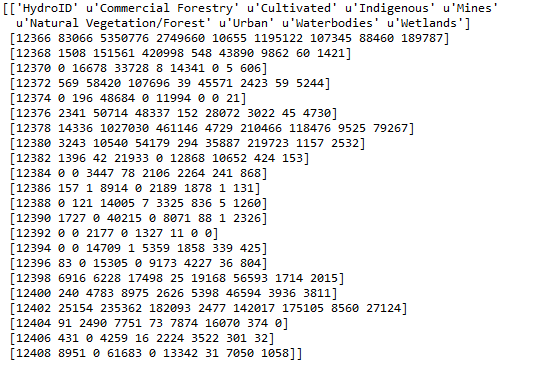
Python Console: Print Statement of array transposed.
- Mark as New
- Bookmark
- Subscribe
- Mute
- Subscribe to RSS Feed
- Permalink
I will have a look again soon....
But, from my example, you will notice that the dtype is 'object' which allows you to flip stuff around without having to worry about dtype.
So the trick (will confirm, done it a few times). Is to retain the dtype of the input array brought in from Arc*, create a new view of the data with an 'object dtype. Do the 'stuff' and when done, rotate back and reapply the original dtype (or parts thereof).
I will revisit within the next day or so.
- Mark as New
- Bookmark
- Subscribe
- Mute
- Subscribe to RSS Feed
- Permalink
Hi Dan
I solved it by using numpy.core.records.fromarrays:
'''
Created on 06 Jul 2016

Zonal Histogram Pivot:

Pivot Results Table

@author: PeterW
'''
# import site-packages and modules
import numpy as np
import arcpy

# set arguments
hist_table = r"E:\Projects\2016\G112669\Calcs.gdb\ftr_watersheds_lu_stats_160706"
output_pivot = r"E:\Projects\2016\G112669\Calcs.gdb\ftr_watersheds_lu_pivot_v2_160712"

# set environment settings
arcpy.env.overwriteOutput = True


# pivot zonal histogram results table
def hist_pivot(hist_table, output_pivot):
    sum_list = []
    fields = [f.name for f in arcpy.ListFields(hist_table)[1:]]
    fields_pivot = ["HydroID" if x == "LABEL" else int(x.replace("Hydro_", "")) for x in fields]
    sum_list.append(fields_pivot)
    with arcpy.da.SearchCursor(hist_table, fields) as scur:# @UndefinedVariable
        for row in scur:
            sum_list.append(list(row))
    arr = np.asarray(sum_list, dtype="object")
    arr_pivot = arr.T
    arr_names = str(", ".join(arr_pivot[0]))
    dtypes_list = ["float64" for number in xrange(len(arr_pivot[0])-1)]
    dtypes_list.insert(0, "int64")
    formats = str(", ".join(dtypes_list))
    rec_arr = np.core.records.fromarrays(arr_pivot[1:].transpose(), formats=formats, names = arr_names)
    print(rec_arr)
    arcpy.da.NumPyArrayToTable(rec_arr, output_pivot)# @UndefinedVariable

hist_pivot(hist_table, output_pivot)
Python Code:

Python Pivot Results Table
- Mark as New
- Bookmark
- Subscribe
- Mute
- Subscribe to RSS Feed
- Permalink
Ohhh I misunderstood.... you forgot to do some reading from Numpy Repository
from numpy.lib._iotools import easy_dtype as easy
your tip of the day. I have attached more readings. Going to root is a good idea, but you have just accessed base recarray functionality... do know the surface names as well 
Attachment added
- Mark as New
- Bookmark
- Subscribe
- Mute
- Subscribe to RSS Feed
- Permalink
Thanks Dan
Truly appreciate your ongoing help and advice.
- Mark as New
- Bookmark
- Subscribe
- Mute
- Subscribe to RSS Feed
- Permalink
Thank you.. it helped a lot