- Home
- :
- All Communities
- :
- Developers
- :
- Python
- :
- Python Questions
- :
- Numpy Pivot: Summary Statistics Results
- Subscribe to RSS Feed
- Mark Topic as New
- Mark Topic as Read
- Float this Topic for Current User
- Bookmark
- Subscribe
- Mute
- Printer Friendly Page
Numpy Pivot: Summary Statistics Results
- Mark as New
- Bookmark
- Subscribe
- Mute
- Subscribe to RSS Feed
- Permalink
!I recently posted the following discussion Convert Summary Table Structure (Python) which I thought I'd resolved with the help from Dan Patterson. Please refer to my previous post for the explanation and the reasoning behind the following. Where I'm currently at is that I have been able to pivot the column Time and populate it with the values from the statistics count results.
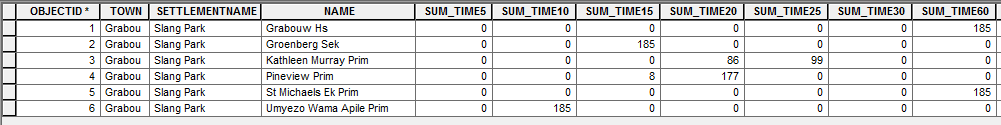
The last hurdle that I'm trying to achieve is to merge the results so that there isn't a new record for each time interval as shown below:

Incorrect Pivot Results:
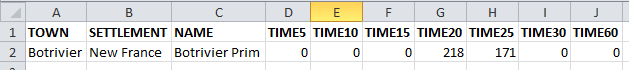
Correct Pivot Results:
'''
Created on April 6, 2016

Summarise Number of Buildings

per Time Interval

(5, 10, 15, 25, 30, 60)

@author: PeterW
'''
# import site-packages and modules
from pathlib import Path
import numpy.lib.recfunctions as rfn
import pandas as pd  # Pandas version 0.13.0
import arcpy


# set arguments
saa_stats_table = r"E:\Projects\2016\G112224\Models\Schools\Schools_Combined_160505.gdb\Botrivier_Prim_SAA_Stats"

# environment settings
arcpy.env.overwriteOutput = True
fgdb = Path(saa_stats_table).parents[0]


def pivot_table(saa_stats_table, fgdb):
    fields = [f.name for f in arcpy.ListFields(saa_stats_table)]
    table_recarray = arcpy.da.TableToNumPyArray(saa_stats_table, fields)  # @UndefinedVariable
    print table_recarray
    df = pd.DataFrame(table_recarray[fields])
    pivot = df.pivot(index="OBJECTID",
                     columns="TIME",
                     values="FREQUENCY").fillna(0, downcast="infer")
    pivot_fields = pivot.columns.values
    # rename pivot fields with prefix "TIME"
    pivot.columns = [("{0}{1}".format("TIME", field)) for field in pivot_fields]
    # convert pandas dataframe to record array
    pivot_recarray = pivot.to_records(index=False)
    pivot_type = pivot_recarray.dtype.descr
    pivot_type_new = [(x[0], x[1].replace(x[1], "<i2")) for x in pivot_type]
    # change pivot record array data type to short integer
    pivot_recarray = pivot_recarray.astype(pivot_type_new)
    fields2 = ["TOWN", "SETTLEMENTNAME", "NAME"]
    table_type_new = [(str(x), "<U25") for x in fields2]
    # change table array data type to unicode 50 characters
    table_recarray = table_recarray[fields2].astype(table_type_new)
    recarray_list = [table_recarray, pivot_recarray]
    # merge table and pivot record array
    summary_array = rfn.merge_arrays(recarray_list, flatten=True, usemask=False)
    summary_table = str(Path(fgdb, "SAA_Stats_Test"))
    # convert merged record array to file geodatabase table
    if arcpy.Exists(summary_table):
        arcpy.Delete_management(summary_table)
        arcpy.da.NumPyArrayToTable(summary_array, summary_table)  # @UndefinedVariable
    else:
        arcpy.da.NumPyArrayToTable(summary_array, summary_table)  # @UndefinedVariable

pivot_table(saa_stats_table, fgdb)
#
Python Code:
Any advice in how I can achieve the following. I suspect it would need to be done either before or after I have merged the two arrays (line 50). Any other alternative that won't require me having to change all my code would really be appreciated as time is a factor at the moment. I urgently need to get my results out.
NB. Please note I dont have an Advance Licence so Pivot_Table is not an option.
Thanks in advance. 
- Mark as New
- Bookmark
- Subscribe
- Mute
- Subscribe to RSS Feed
- Permalink
Peter, in Column C in the both images... they are different and the latter image has 2 unique rows, which is correct. In order to consolidate and add the rows together column C must contain the same unique values so you are going to have to truncate Botrivier Prim to Botrivier, or append Prim to the second row. The classification needs to be unique, not unique-ish
- Mark as New
- Bookmark
- Subscribe
- Mute
- Subscribe to RSS Feed
- Permalink
Hi Dan
Column C would be the same. The reason that the second image is different was just to show that there could be values from Time5 - Time60 depending of the statistics results. The second record within the second image would have been four records within the first image. I've replaced the second image to show only one record and filled the empty columns to depict that the Time range of possible results depending on the statistics results.
- Mark as New
- Bookmark
- Subscribe
- Mute
- Subscribe to RSS Feed
- Permalink
If you are now getting figure 1 could you run Dissolve—Help | ArcGIS for Desktop and sum fields D-J
- Mark as New
- Bookmark
- Subscribe
- Mute
- Subscribe to RSS Feed
- Permalink
Hi Wes
The following is an output from Summary Statistics so you can't use Dissolve, thanks for the suggestion though. 
- Mark as New
- Bookmark
- Subscribe
- Mute
- Subscribe to RSS Feed
- Permalink
I've found a temporary solution to the following, using Summary Statistics. I'd really appreciate any advice in how to alter my NumPy Function to get the results out within the correct format.
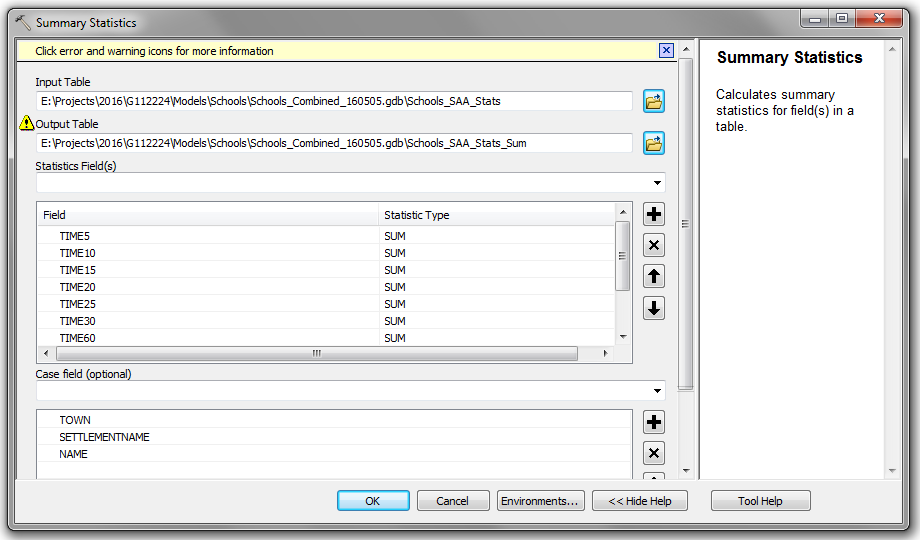
The following will allow me to get my results out today.
Thanks for the advice so far.
- Mark as New
- Bookmark
- Subscribe
- Mute
- Subscribe to RSS Feed
- Permalink
Peter, check my documentation closely, I successfully got it to summarize within a time period, I don't know why yours is different, I haven't looked at the Pandas shroud over the base numpy implementation. I will look through when I get a chance but there is definitely no need to summarize but for now that will have to be the work around.
Looking at your last example, the implementation I am referring to does a np.unique and np.where on whatever field, then sums for the remaining numeric columns (or specified numeric columns)
- Mark as New
- Bookmark
- Subscribe
- Mute
- Subscribe to RSS Feed
- Permalink
Peter it is called Observation_Summary_1.pdf in Numpy Repository... I won't post the link here to save getting a whole bunch of "the link doesn't work" questions.
- Mark as New
- Bookmark
- Subscribe
- Mute
- Subscribe to RSS Feed
- Permalink
Hi Dan
Thanks Dan, will have a look at the following.
- Mark as New
- Bookmark
- Subscribe
- Mute
- Subscribe to RSS Feed
- Permalink
Hi Dan
I've used the code example within your "Observation_Summary_1.pdf" and understand the most of your code, but if you wouldn't mind unpacking from Line 45 to 50. I'm unsure if line 45 is a list comprehension of some sort and not understanding the how its working.
# coding: utf-8
"""
Dan Patterson:

Numpy Pivot Table Summary

16/05/2016

"""
# import site-packages and modules
import numpy as np
import arcpy

# set input summary table
input_table = r"E:\Projects\2016\G112224\Models\Schools\Schools_Combined_160505.gdb\De_Villiers_Graaff_Hs_SAA_Stats"
output_gdb = r"E:\Python\Testing\dan_patterson_numpy\SAA_Summary_Report_Testing.gdb"


# numpy pivot table function
def pivot_summary(input_table, output_gdb):
    # convert summary table to structured numpy array
    numpy_fields = ("OBJECTID", "TOWN", "SETTLEMENTNAME",
                    "NAME", "TIME", "FREQUENCY")
    sum_array = arcpy.da.TableToNumPyArray(input_table, numpy_fields)  # @UndefinedVariable
    # obtain unique records based on first three columns
    unique_records = np.unique(sum_array[['TOWN', 'SETTLEMENTNAME', 'NAME']])
    # number of unique rows
    shp = len(unique_records)
    # construct the output array
    dt = [('TOWN', 'U20'), ('SETTLEMENTNAME', 'U20'), ('NAME', 'U20'),
          ('TIME5', np.int32), ('TIME10', np.int32), ('TIME15', np.int32),
          ('TIME20', np.int32), ('TIME25', np.int32), ('TIME30', np.int32),
          ('TIME60', np.int32)]
    # populate array with zeros
    pivot_array = np.zeros(shp, dtype=dt)
    # assign the first three columns
    pivot_array['TOWN'] = unique_records['TOWN']
    # the values from the unique test
    pivot_array['SETTLEMENTNAME'] = unique_records['SETTLEMENTNAME']
    # everything is sorted
    pivot_array['NAME'] = unique_records['NAME']
    # loop through unique records array
    for i in range(shp):
        # pull out the rows that match
        row_match = sum_array[sum_array[['TOWN', 'SETTLEMENTNAME',
                                        'NAME']] == unique_records]
        for j in range(len(row_match)):
            column = 'TIME' + str(row_match['TIME'])
            buildings = row_match['FREQUENCY']
            pivot_array[column] = buildings
    pivot_table = "{0}\\{1}".format(output_gdb, "Pivot_Table_Summary")
    arcpy.da.NumPyArrayToTable(pivot_array, pivot_table)  # @UndefinedVariable
    return pivot_table

pivot_table = pivot_summary(input_table, output_gdb)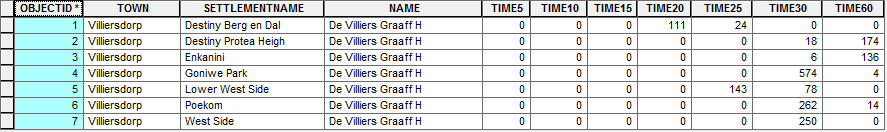
Thanks for your help Dan