- Home
- :
- All Communities
- :
- Developers
- :
- Python
- :
- Python Questions
- :
- Display results/layers in Spyder Jupyter Notebook
- Subscribe to RSS Feed
- Mark Topic as New
- Mark Topic as Read
- Float this Topic for Current User
- Bookmark
- Subscribe
- Mute
- Printer Friendly Page
Display results/layers in Spyder Jupyter Notebook
- Mark as New
- Bookmark
- Subscribe
- Mute
- Subscribe to RSS Feed
- Permalink
Is there a way to visualize query results (like a Query Table or layer) in either of these IDE's? I know you can leverage the arcgis module in Jupyter, but here you're beholden to a web GIS. What if you're just running queries against an SQL instance? I really like both of these IDE's but at least if you're using the ArcGIS Python window (Dan Patterson don't shoot me!) you see your results displayed directly (as a table or layer).
Any thoughts? Maybe I'm missing something really obvious here.
Thanks!
- Mark as New
- Bookmark
- Subscribe
- Mute
- Subscribe to RSS Feed
- Permalink
import arcpy
f = r"C:\Git_Dan\JupyterNoteBooks\Data\Shapefiles\test.shp"
a = arcpy.da.TableToNumPyArray(f, "*")
sub = a[(a['FID'] > 2) & (a['C'] < 10)]
frmt_rec(sub)
--n-- FID Shape C D E F G H I J K L
---------------------------------------------------------------------------------------------------
000 3 [4. 9.] 7.62 8.94 8.25 0.00 4.47 3.16 2.24 5.83 8.54 7.28
001 4 [0. 7.] 8.60 10.00 6.32 4.47 0.00 1.41 5.00 7.62 6.08 5.39
002 5 [1. 8.] 8.49 9.90 7.07 3.16 1.41 0.00 4.12 7.21 7.00 6.08
003 6 [5. 7.] 5.39 6.71 6.71 2.24 5.00 4.12 0.00 3.61 7.21 5.83
004 7 [7. 4.] 2.00 3.16 5.83 5.83 7.62 7.21 3.61 0.00 6.71 5.39
005 8 [1. 1.] 6.08 7.00 1.00 8.54 6.08 7.00 7.21 6.71 0.00 1.41
006 9 [2. 2.] 5.00 6.08 1.00 7.28 5.39 6.08 5.83 5.39 1.41 0.00You can always query the results and convert the table to a numpy array using.
If you are nice I will even share my fancy formatting function 
Done in Spyder
- Mark as New
- Bookmark
- Subscribe
- Mute
- Subscribe to RSS Feed
- Permalink
Dan,
that makes good sense and is very helpful!
Maybe for a bit of context, as a novice python user, I hack my way towards creating things I need to get done. Even with all the shortcomings of the python window in ArcGIS, I'll often use that to bash away at various tools and I'll have an immediate idea (a visualization of the output) if they're gonna work or not. If one was to say try to figure out SelectLayerByLocation_management, you could do so and see your results right away and then build that into a tool/script/function.
I'm loving Jupyter & Spyder, (especially given my envy every time a colleague shows me what they're doing in R-Studio [but let's not start the Rodeo debate, right?]). I know I can't get the visualization end of things in Jupyter using our web GIS, but that's not what I'm trying to achieve here.
Maybe I'm just having a Goldilocks moment and want the perfect thing? Anyway, hopefully the background is helpful, but maybe what i'm looking for just doesn't exist outside ArcGIS.
Thanks!
- Mark as New
- Bookmark
- Subscribe
- Mute
- Subscribe to RSS Feed
- Permalink
I just use the code snippets in the help file, if needed.
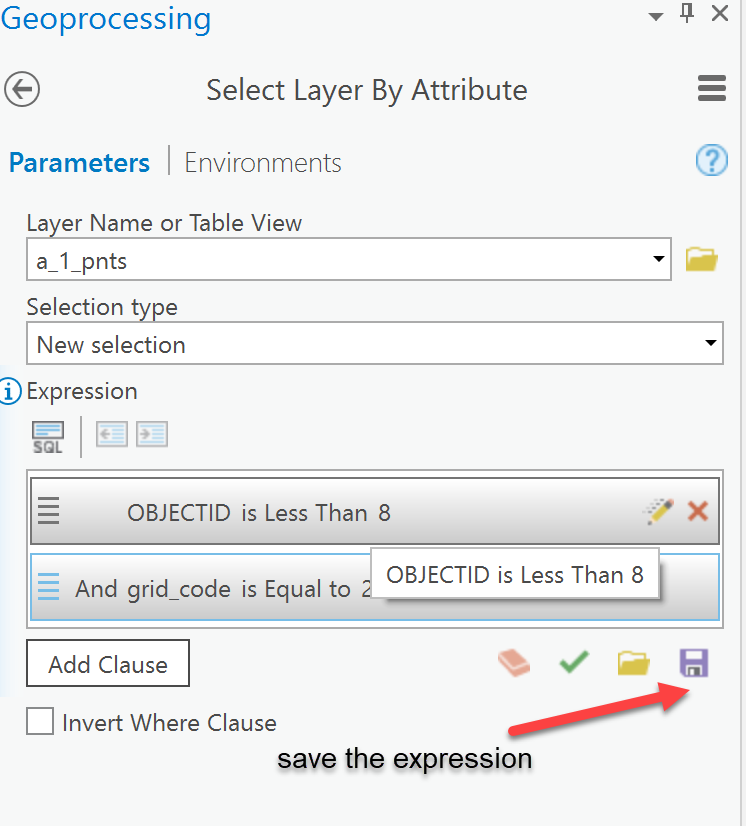
This just saves the expression which is pretty useless...
Now the selection works

so you go here
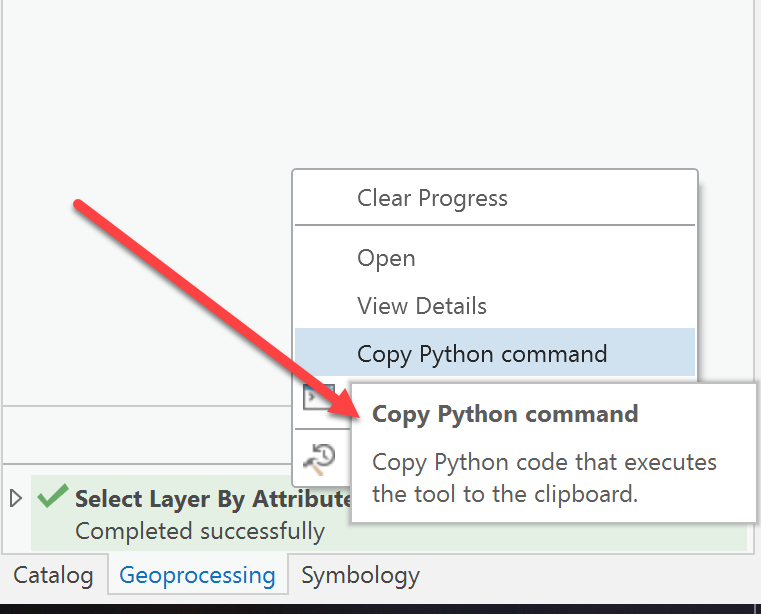
and copy the python command and … voila!
arcpy.management.SelectLayerByAttribute("a_1_pnts", "NEW_SELECTION", "OBJECTID < 8 And grid_code = 2", None)
- Mark as New
- Bookmark
- Subscribe
- Mute
- Subscribe to RSS Feed
- Permalink
Thanks Dan. I have used python snippets in the past as a learning tool.
Let me try to explain a little further. One of the redeeming qualities of using the python window in ArcGIS is that you are able to see your results, and therefore know that the command you executed works. Instant feedback.
- Mark as New
- Bookmark
- Subscribe
- Mute
- Subscribe to RSS Feed
- Permalink
yes... good for snippets or one liners but you do get feedback in spyder if you make a mistake... you just have to know what they mean.
Use all! I usually have 2 IDE's open but not that sad arcmap python window (but that is another story)
- Mark as New
- Bookmark
- Subscribe
- Mute
- Subscribe to RSS Feed
- Permalink
Solid advice...thanks!
- Mark as New
- Bookmark
- Subscribe
- Mute
- Subscribe to RSS Feed
- Permalink
Try importing pandas and using df = pd.DataFrame.from_records(data=arcpy.da.SearchCursor(fc,fields),columns=fields)
where fc is your GIS feature class layer and fields are a list of fields in fc you define
format the data frame and print tables, display tables, or display(HTML(table.to_html())) for larger outputs
try using group by with .sum or .apply and lambda functions for fast results printed in the jupyter output window