- Home
- :
- All Communities
- :
- Developers
- :
- Python
- :
- Python Questions
- :
- arcpy modify graph legend default text
- Subscribe to RSS Feed
- Mark Topic as New
- Mark Topic as Read
- Float this Topic for Current User
- Bookmark
- Subscribe
- Mute
- Printer Friendly Page
- Mark as New
- Bookmark
- Subscribe
- Mute
- Subscribe to RSS Feed
- Permalink
I am building a multiple series vertical bar graph with arcpy.Graph in ArcMap 10.6.1. The short version is:
import arcpy
TESTDIR = <some dir>
arcpy.env.workspace = TESTDIR
arcpy.env.scratchWorkspace = TESTDIR
arcpy.env.overwriteOutput = True
arcpy.env.qualifiedFieldNames = False
outGraphName = "VerticalBarGraph"
outGraphJpeg = "VerticalBarGraph.jpg"
inputTemplate = "SeriesComparison1.grf"
graph = arcpy.Graph()
inFieldNames = [f.name for f in arcpy.ListFields("OUT.dbf") if f.name != 'OID']
for i in range(1, len(inFieldNames)):
graph.addSeriesBarVertical("OUT.dbf", inFieldNames[i], "LABEL")
arcpy.MakeGraph_management(inputTemplate, graph, outGraphName)
arcpy.SaveGraph_management(outGraphName, outGraphJpeg, "MAINTAIN_ASPECT_RATIO", 1000)The output is just what I am after except that for three input fields it produces a legend with entries:
Vertical Bar
Vertical Bar 2
Vertical Bar 3
These can be changed interactively in ArcMap (see below) and I have done this to generate the template graph. I want to use Python to change these defaults, depending on user input, to the names of the input fields but I have had no success. I have been reduced to trying to reverse engineer what's going on in the interactive view:
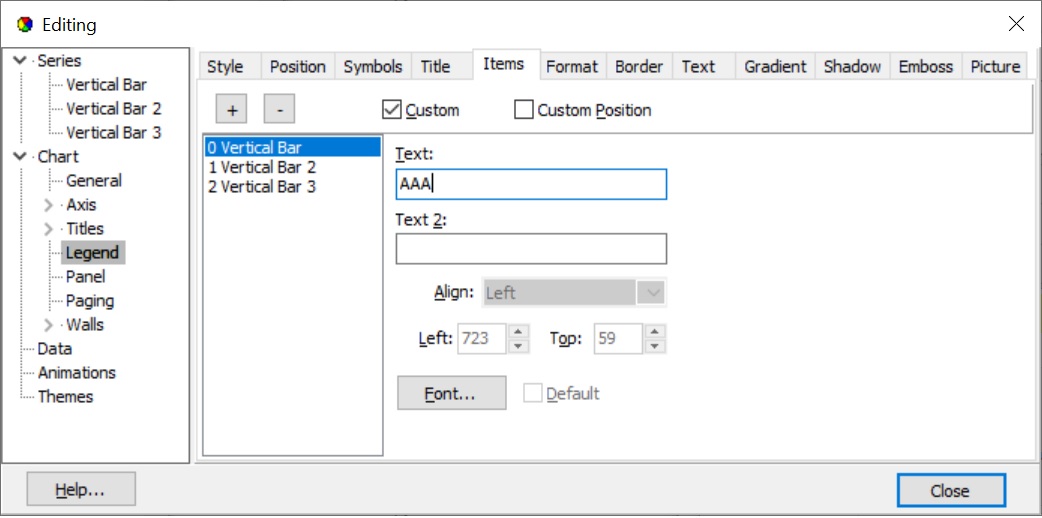
by adding a couple of lines to the for loop above:
for i in range(1, len(inFieldNames)):
graph.addSeriesBarVertical("OUT.dbf", inFieldNames[i], "LABEL")
graph.graphSeries[i - 1].Custom = True
graph.graphSeries[i - 1].Text = inFieldNames[i]These instructions are accepted and I can print out their values but they have no effect on the graph output.
Is what I am trying to do possible with arcpy? Perhaps I am looking in the wrong place. I would be grateful for any advice.
Ian
Solved! Go to Solution.
Accepted Solutions
- Mark as New
- Bookmark
- Subscribe
- Mute
- Subscribe to RSS Feed
- Permalink
As near as I can establish, it can't be done. I have used matplotlib ( https://matplotlib.org/ ) instead.
- Mark as New
- Bookmark
- Subscribe
- Mute
- Subscribe to RSS Feed
- Permalink
As near as I can establish, it can't be done. I have used matplotlib ( https://matplotlib.org/ ) instead.