- Home
- :
- All Communities
- :
- Developers
- :
- Python
- :
- Python Questions
- :
- ArcGIS 10.2.2 arcpy Cell Statistics giving Incorre...
- Subscribe to RSS Feed
- Mark Topic as New
- Mark Topic as Read
- Float this Topic for Current User
- Bookmark
- Subscribe
- Mute
- Printer Friendly Page
ArcGIS 10.2.2 arcpy Cell Statistics giving Incorrect Values
- Mark as New
- Bookmark
- Subscribe
- Mute
- Subscribe to RSS Feed
- Permalink
Hey everyone, I've been having some issues using the cell statistics tool in a python script recently. The issue is occurring in a stand alone script. I am trying to calculate standard deviation across 30 tif's representing annual cumulative rainfall for the globe.
While most of the values in the resulting raster (also a tif) are correct, there are large pockets of data that have extremely high standard deviation values (around 2000 - 3000 when they should be around 150).
When I run the same analysis in ArcGIS using the cell statistics geoprocessing tool the output is correct and I do not see these irregular values.
Does anyone have any idea why this would be happening? I assumed at first it was something wrong with my script but how could only some of the values be incorrect? There are also no no data values in these issue areas that could be causing the miscalculation although there is a no data value set in all of the input rasters.
I am providing statistics on the two raster in case it is helpful to anyone.
script output:
min = 0
max = 6697.9404296875
mean = 75.83343676729601
std. dev. = 333.72000491046
arcmap output:
min = 0
max = 1507.4833984375
mean = 35.804817248754
std. dev. = 84.35107381816201
Solved! Go to Solution.
- Mark as New
- Bookmark
- Subscribe
- Mute
- Subscribe to RSS Feed
- Permalink
yes means and std devs are in the units of the data... which isn't a problem, just state your problem and report your results that way you could scale everything cm or meter though, since the scaling is proportional
xm = 10 mm std dev = 20 mm is the same as 1 cm, 2 cm ... 1m 2m. But you will only believe me when you do the math in a spreadsheet ...
- Mark as New
- Bookmark
- Subscribe
- Mute
- Subscribe to RSS Feed
- Permalink
Yes, I understand that mean and standard deviation would be reported in the units of the data. In my case all input data is in mm so the mean and standard deviation would also be in mm.
However, I'm asking about the large discrepancy I was seeing between the standard deviation that was calculated using integer input and floating point input (both in mm units). When my analysis was run using integer values I would get a standard deviation value for a particular pixel of around 2000. When I ran the analysis again using floating point input the value changed for the same pixel to around 300 - the value of around 300 being the correct standard deviation value.
Why would there be such a large difference between these two values? I would expect to see a small variance across the two calculations but nothing close to the difference I was seeing.
- Mark as New
- Bookmark
- Subscribe
- Mute
- Subscribe to RSS Feed
- Permalink
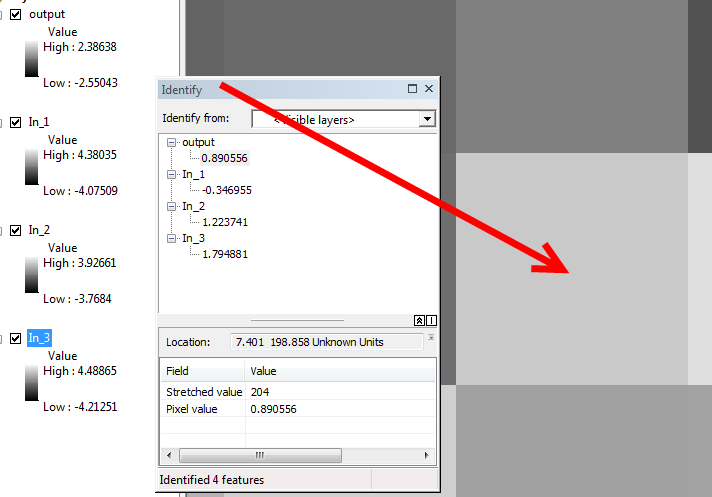
A good idea, initially, might be to work with a subset of your data, say 3 rasters and in ArcMap zoom to a single pixel and use identify to get the value of all 4 (3 input and 1 output from CellStats) at that location.
- Mark as New
- Bookmark
- Subscribe
- Mute
- Subscribe to RSS Feed
- Permalink
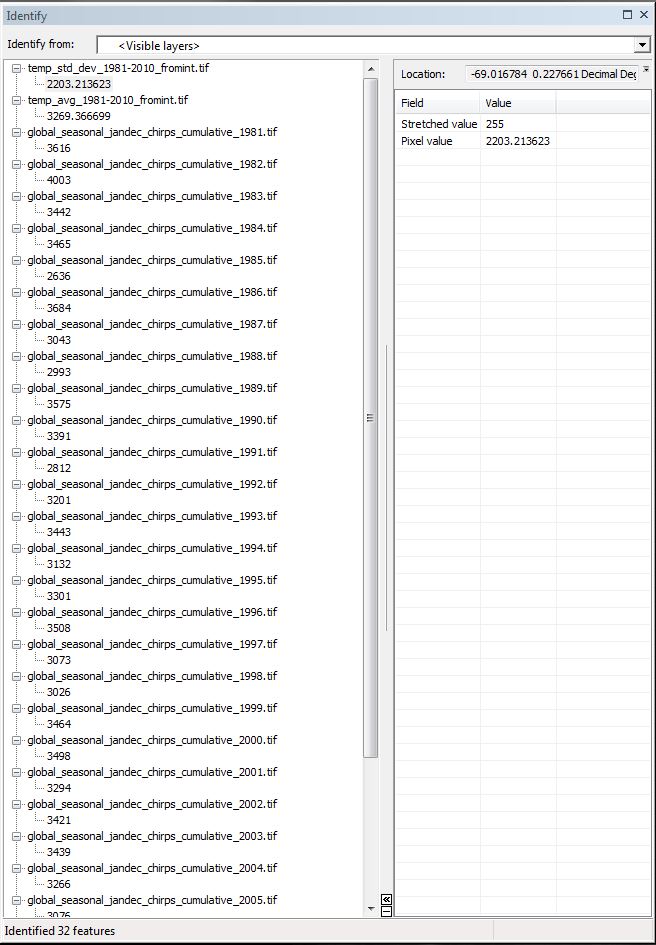
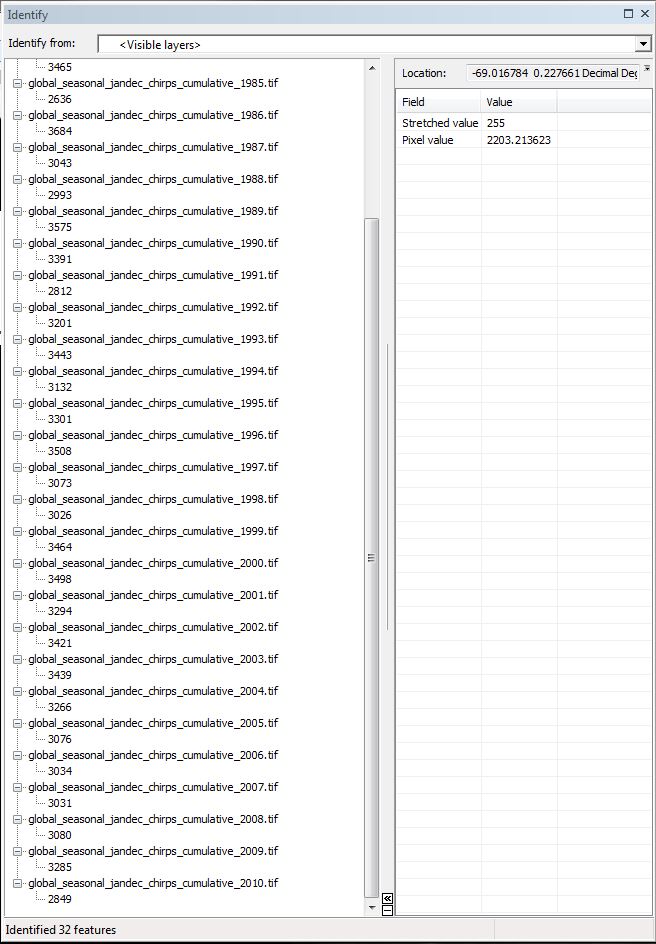
I have been doing some more testing and found a couple of things. It looks like the issue is cropping up when the input rasters are below 32 bit. I must have been mistaken before when I said the input was 32 bit integer rasters. When input is 16 bit I am seeing the very high std dev values. When I do the same calculation using 32 bit floats or ints the issue disappears.
I am attaching two screen shots of an Identify I did on a pixel that I see as having issues. I included all 30 input and unfortunately I could not fit it all in one screen shot.
- Mark as New
- Bookmark
- Subscribe
- Mute
- Subscribe to RSS Feed
- Permalink
Is there a possibility that since the input values are so large that when the standard deviation is being calculated the total (for calculating mean) is hitting the limit of what a 16 bit integer can hold (65,535)? That would greatly decrease the mean and lead to increased deviation in the calculation. It could also explain why the calculation works when using 32 bit rasters as input and only gives me incorrect values in some areas of the output when using 16 bit rasters as input.
Just floating the idea.
I realize the mean in the screen shots is correct for the given numbers but that was calculated in a separate call to the cell statistics tool just to show what the mean should be.
- Mark as New
- Bookmark
- Subscribe
- Mute
- Subscribe to RSS Feed
- Permalink
time to try something other than a tiff as the inputs to this process ... esri grid or numpy array...
- Mark as New
- Bookmark
- Subscribe
- Mute
- Subscribe to RSS Feed
- Permalink
I converted all of my 16bit integer tifs to grids with integer values. The analysis ran correctly and gave me results identical to using 32 bit tifs as input.
- Mark as New
- Bookmark
- Subscribe
- Mute
- Subscribe to RSS Feed
- Permalink
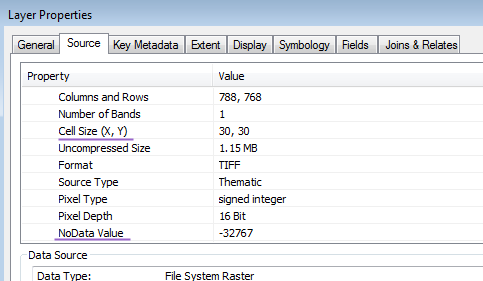
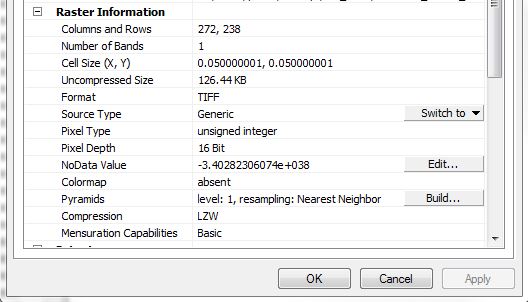
For the 16 bit integer tifs, what is their NoData value? Are all the input rasters in the same cell size? (I am suspecting that this issue is related to NoData handling during the resampling). You may find out the NoData and Cell Size info from the layer properties dialog, as shown by the following screen capture:
- Mark as New
- Bookmark
- Subscribe
- Mute
- Subscribe to RSS Feed
- Permalink
Sorry it took so long to respond. Was busy with work. Here is a screen shot of a layers properties window. All of the input rasters have the same properties.
- Mark as New
- Bookmark
- Subscribe
- Mute
- Subscribe to RSS Feed
- Permalink
so your data look like they are in decimal degrees...unless you are using a 5cm cell size. Source type is Generic (switch to does nothing I presume?)
It says unsigned integer, 16 bit, but your nodata value is looks strange particularly when you compare it to Xuguang's