- Home
- :
- All Communities
- :
- Developers
- :
- Python
- :
- Python Blog
- :
- Math and Stats with NumPy... Normalize data
Math and Stats with NumPy... Normalize data
- Subscribe to RSS Feed
- Mark as New
- Mark as Read
- Bookmark
- Subscribe
- Printer Friendly Page
Short one
Came up in a question. I sadly suggested a spreadsheet. To correct this, here is the numpy solution.
| Normalizing data... |
|---|
Here is the input and output tables
|
|
|
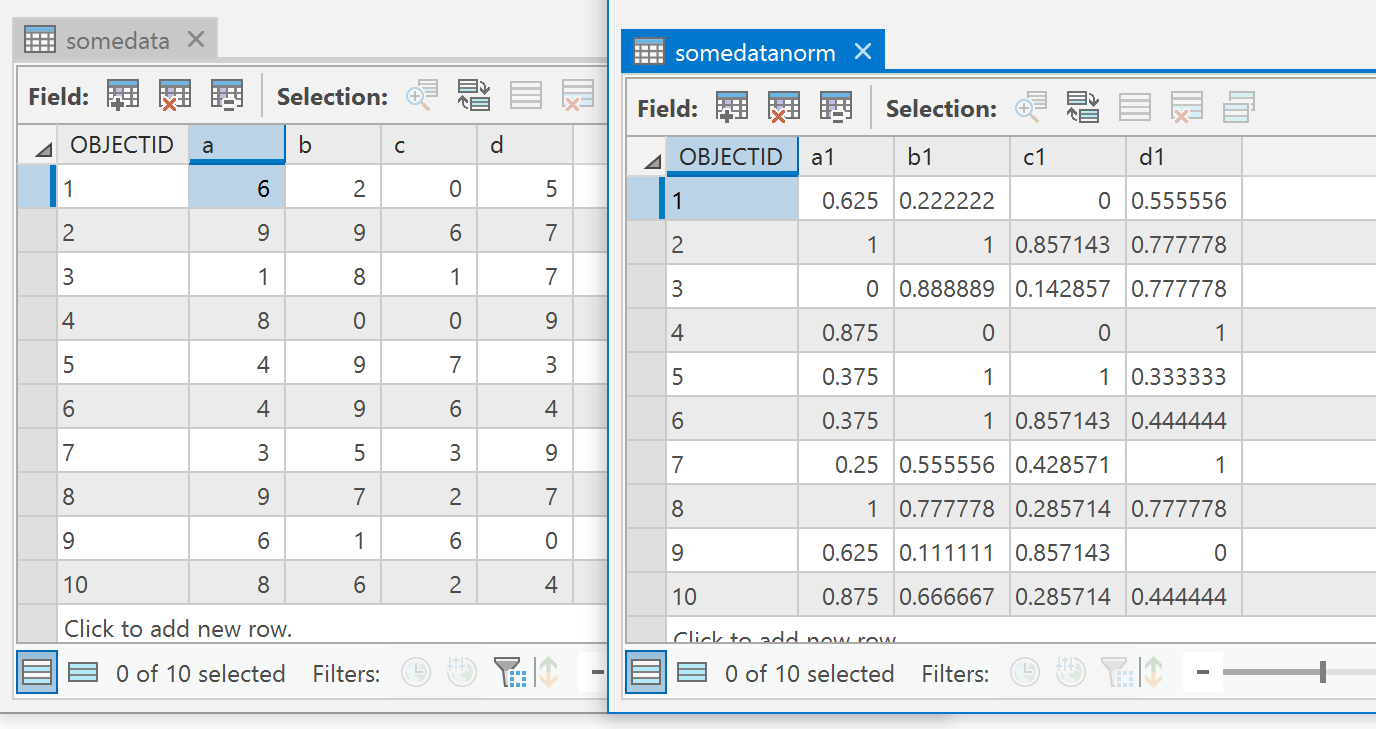
Line 1 and 2, read the table from ArcGIS Pro
Line 3, 'view' the array as a floating point numbers.
Line 4, create an output data type for sending it back
Line 5, normalize the data
Lines 6 to 10, bumpfh to send it back to Pro as a table
Normalize... hope I got it right... take the array, subtract the min then divide by the range. np.ptp is the 'point-to-point' function which is the range
Normalize by row, column or overall
Now, lets assume that an input dataset could be data arranged by row, column or as a raster... We need to change of normalize equation just a bit to see the results.
| Header 1 |
|---|
|
Lots of stuff you can do
You must be a registered user to add a comment. If you've already registered, sign in. Otherwise, register and sign in.