- Home
- :
- All Communities
- :
- Developers
- :
- Python
- :
- Python Blog
- :
- Focal and Local Statistics for Rasters... the "Spe...
Focal and Local Statistics for Rasters... the "Special Analyst"
- Subscribe to RSS Feed
- Mark as New
- Mark as Read
- Bookmark
- Subscribe
- Printer Friendly Page
Striding - Sliding - Moving - Rolling
One of my favorite topics.
It was an innocuous question
How to count the adjacent cells that have a different value in a raster dataset?
Obviously! Focal statistics in the Spatial Analyst extension.
There has to be one of them … not focal mean, median, min, max, std dev, var, range... that leaves majority, minority and variety, - close, but no vape. The catch was, that Mark needed to know the number of cells in the immediate neighborhood that differed in value from the core/focal cell. As such, variety wouldn't cut it since variety since all 9 cells in a 3x3 window are considered without comparison to the focal cell. I will address the final puzzle at the end, but let us begin with some basics.
Striding function basics
Begin with a basic array with 4 rows and 5 columns. This is a raster of course because I could save it out to esri grid or tif format.
Now if I begin shifting a 3x3 window over the top of the raster we begin to form the data in lines 9 and on. But how did I arrive at?
Steps
- pick a nodata value... in this case I have decided that 0 represents nodata.
- convert the nodata values to "not a number... nan"
- pad the raster by 1 cell using a constant value (nan) on all 4 sides
- slide beginning at the top left of the padded array. In this case a 3x3 moving window was used. The 'window' is stepped 1 column at a time until the end of the first row is reached, then a step down a row follows this .
Figure 1 |
|---|
Striding a simple array/raster |
-----------
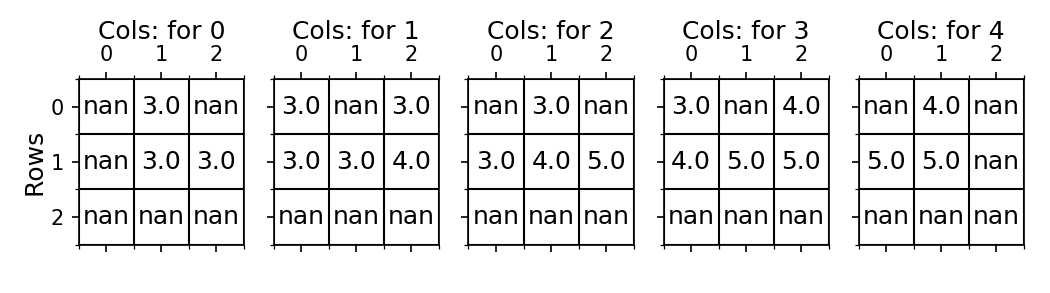
How about in pictoral form
Some people don't work well with numbers so have a gander.
Remember, we are simply sliding a 3x3 window over by 1 column until it hits the end of the row, then it drops one row and repeats. nan in both situations is Not A Number. There is Nan, NaT (not a time) but no Nai (not an integer). Integers require you temporarily upscale the data to floats, process, then downgrade... or use masked arrays or masked operations.
-----------> Sliding over one column at a time ---------->
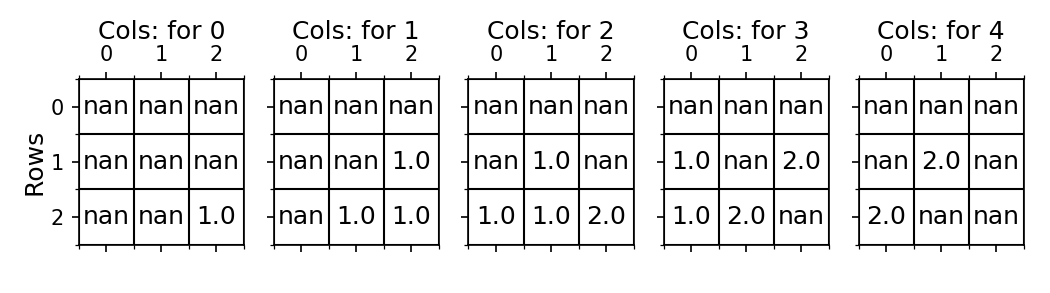
Shift down a row
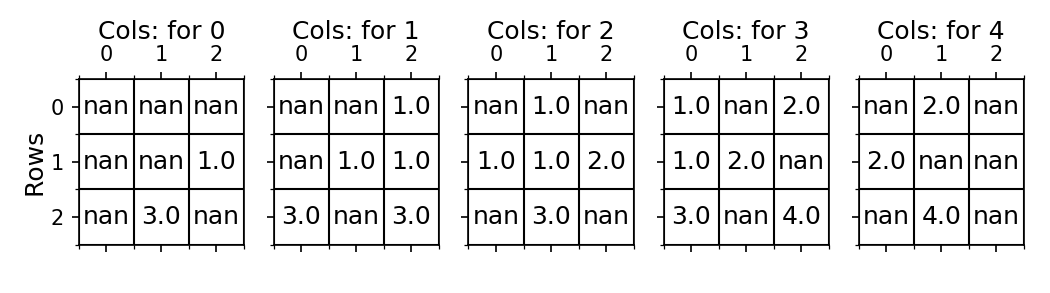
Again
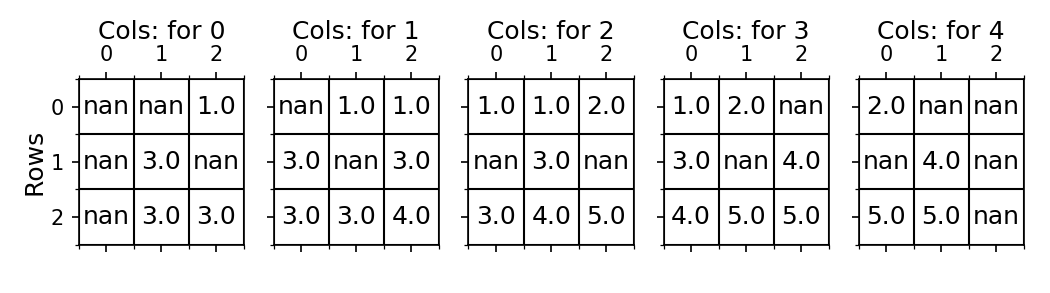
And Again
---------
Some Examples of Focal Statistics
Here are some examples... see if you can do the mental moving math.
You can make 2 choices when doing focal statistics.
- if the focal cell is nan, process the surrounding cells for the statistics.
- if nan is focal cell is nan... assign nan to the result
Both options have their uses, for example to 'smooth' out data getting rid of nodata speckles, the first option would be chosen. In the situations that you want to preserve locale observations, you would use the second option.
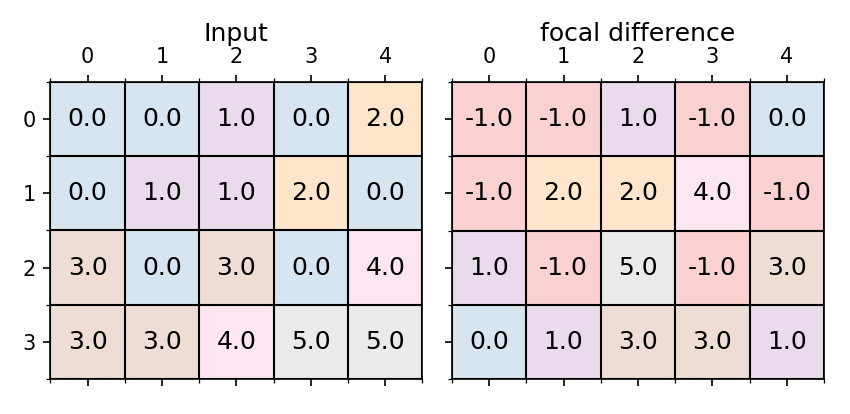
A hard one (sort of)
The difference of the surround cells from the core cell accounting for nodata and assigning nodata if the focal cell is nodata. In the original array, nodata was 0 and in the output -1 is used.
An easy one (the maximum)
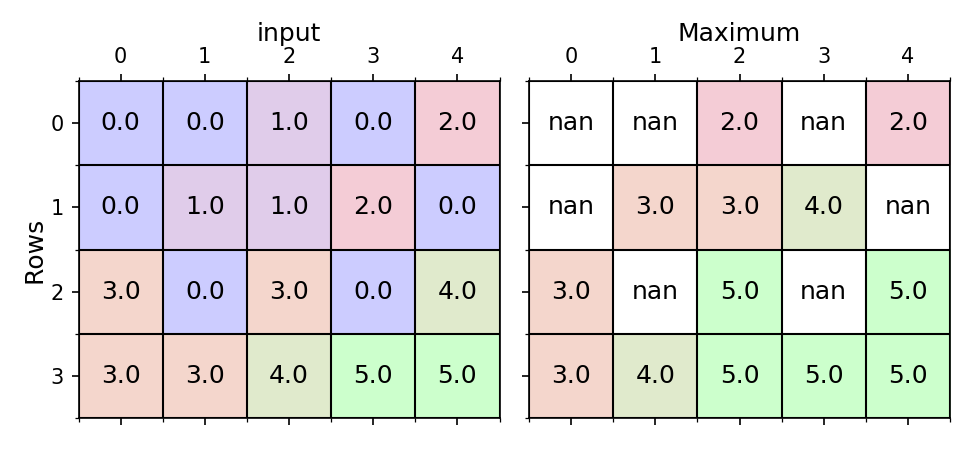
The sample code that does the focal maximum. The padding and striding function can be found on the toolbox on the
ArcGIS Code Sharing site.
The link is ….. Raster Tools: Focal and Local Statistics
If you have any other raster functionality that involves multidimensional arrays/rasters that you need implemented, send me an email and I will add them to the "Special Analyst" toolset. 
You must be a registered user to add a comment. If you've already registered, sign in. Otherwise, register and sign in.