Demo code... This simple sample code should give you some ideas. In this version, edge considerations are not accounted for, so should that be an issue, you can pad the array with an appropriate collar. """
Script: aggregate_demo.py
Modified: 2016-01-30
Author: Dan.Patterson AT carleton.ca
Purpose: To demonstrate aggregation of raster data without the
spatial analyst extension. A sample raster is created and methods
to convert an array to a raster and vice versa are shown.
Notes:
- RasterToNumPyArray(in_raster, {lower_left_corner},
{ncols}, {nrows}, {nodata_to_value})
arr = arcpy.RasterToNumPyArray(rast)
- NumPyArrayToRaster(in_array, {lower_left_corner}, {x_cell_size},
{y_cell_size}, {value_to_nodata})
rast = arcpy.NumPyArrayToRaster(a, arcpy.Point(300000,5025000),
10,10,-9999)
rast.save(r"F:\Demos\raster_ops\test_agg")
"""
import numpy as np
from numpy.lib.stride_tricks import as_strided
np.set_printoptions(edgeitems=3,linewidth=80,precision=2,
suppress=True,threshold=50)
from textwrap import dedent
import arcpy
arcpy.env.overwriteOutput = True
def block_a(a, block=(3,3)):
"""Provide a 2D block view of a 2D array. No error checking made.
Columns and rows outside of the block are truncated.
"""
a = np.ascontiguousarray(a)
r, c = block
shape = (a.shape[0]/r, a.shape[1]/c) + block
strides = (r*a.strides[0], c*a.strides[1]) + a.strides
b_a = as_strided(a, shape=shape, strides=strides)
return b_a
def agg_demo(n):
"""Run the demo with a preset array shape and content.
See the header.
"""
a = np.random.random_integers(0,high=5,size=n*n).reshape((n,n))
rast = arcpy.NumPyArrayToRaster(a,x_cell_size=10)
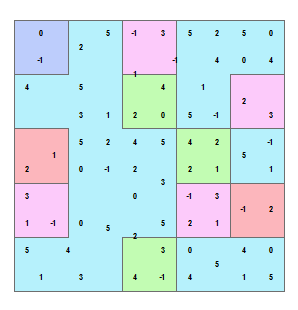
agg_rast = arcpy.sa.Aggregate(rast,2,"MAXIMUM")
agg_arr = arcpy.RasterToNumPyArray(agg_rast)
a_s = block_a(a, block=(2,2))
a_agg_max = a_s.max(axis=(2,3))
frmt = "\nInput array..\n{}\n\n" \
"Arcpy.sa aggregate..\n{}\n\n" \
"Numpy aggregate..\n{}\n\n" \
"All close? {}"
yup = np.allclose(agg_arr,a_agg_max)
print(dedent(frmt).format(a, agg_arr, a_agg_max, yup))
return a, agg_arr, a_s, a_agg_max
if __name__=="__main__":
""" Returns the input array, it's aggregation raster from
arcpy.sa, the raster representation of the raster and the
block representation and the aggregation array.
"""
n=10
a, agg_arr, a_s, a_agg_max = agg_demo(n)
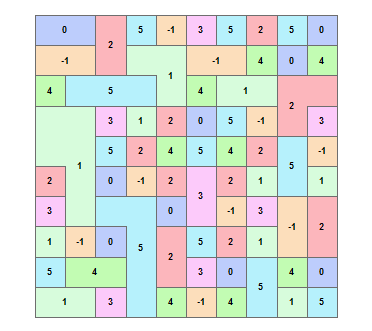
| This is a sample ascii file so that you can see the numeric inputs and structure of the ascii header and its data. ncols 10
nrows 10
xllcorner 300000
yllcorner 5025000
cellsize 10
NODATA_value -9999
0 0 2 5 -1 3 5 2 5 0
-1 -1 2 1 1 -1 -1 4 0 4
4 5 5 5 1 4 1 1 2 2
1 1 3 1 2 0 5 -1 2 3
1 1 5 2 4 5 4 2 5 -1
2 1 0 -1 2 3 2 1 5 1
3 1 5 5 0 3 -1 3 -1 2
1 -1 0 5 2 5 2 1 -1 2
5 4 4 5 2 3 0 5 4 0
1 1 3 5 4 -1 4 5 1 5
Does it work with big rasters? Does it support other summary statistics? Of course, I covered the details of raster statistics in an earlier post. |