Petroleum Blog - Page 2

cancel
Showing results for 
Show  only  | Search instead for 
Did you mean: 

Latest Activity

(22 Posts)
ShareUser
Esri Community Manager

Intended for database administrators as recommendations for establishing the product workspaces in an Enterprise Geodatabase (Oracle®, SQL Server®, PostgreSQL®).

Read more...

more
0 0 1,180
ShareUser
Esri Community Manager

Mapping & Charting Solutions (MCS) Enterprise Databases Best Practices

Intended for database administrators as recommendations for establishing the product workspaces in an Enterprise Geodatabase (Oracle®, SQL Server®, PostgreSQL®).

Read more...

more
0 0 1,589
bboulmay
Esri Alum

The annual Esri User Conference is back!  It was a great show and we hosted several activities specific to the petroleum community included the energy social, user presentation sessions, the special interest PUG meeting, and more.  Read the blog for more detail!

Read more...

more
1 0 2,274
SarahPowell1
Esri Contributor

https://www.esri.com/en-us/about/events/partner-conference/overview

Join us for the exclusive and now, a virtual event for partners and distributors. 


Read more...

more
0 0 1,768
by Anonymous User
Not applicable

         ArcGIS Analytics for IoT enables real-time and big data processing and analysis capabilities in ArcGIS Online.  It enables users to ingest, visualize, and analyze spatial real-time and big data to gain new insights and take action.  Hosted entirely in the cloud, it enables oil and gas companies to explore streaming IoT data on maps and dashboards, identify temporal patterns, and extract location-based intelligence.  You can start leveraging spatial big data to gain real-time visibility into day-to-day operations and make efficient decisions based on increased situational awareness.

For oil & gas companies, Analytics for IoT can help you to implement processes that

  • improve the health and safety of people and assets,
  • reduce operating costs through remote monitoring,
  • increase the efficiency of your production operations, and 
  • enhance situational awareness.

         We recently hosted a webinar on this solution which you can view the recording of on YouTube: Analytics for IoT for Oil and Gas

Below is a summary of what demonstrations were shown in the webinar.

Integrate Any IoT Data Feed into a Map

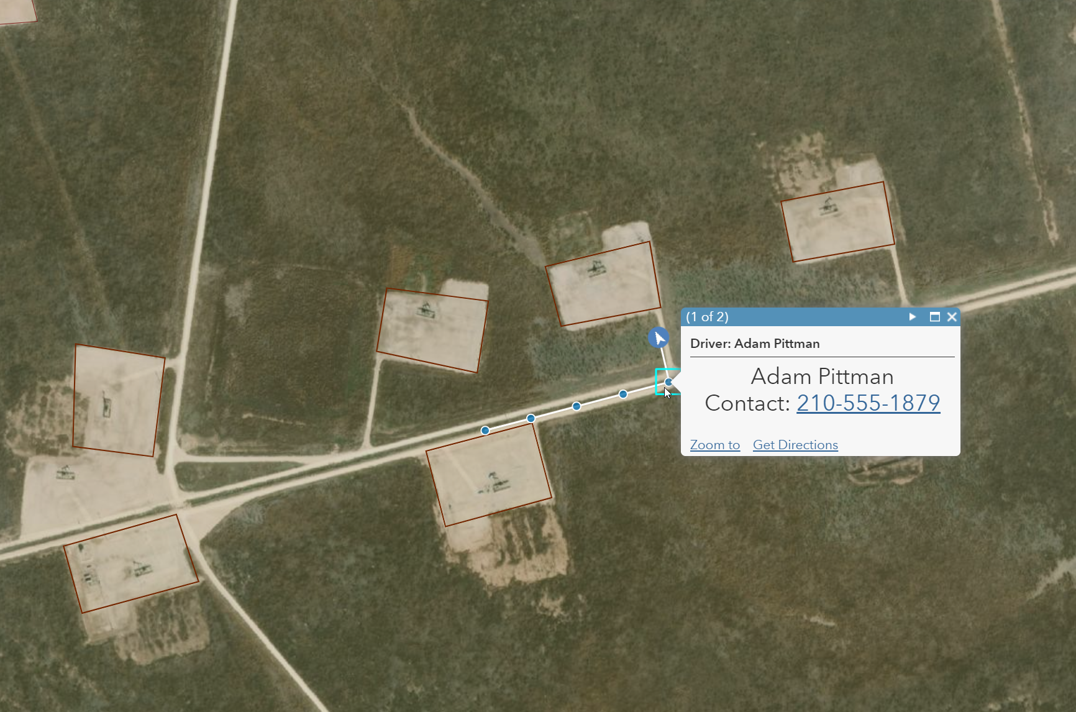
         In the first demonstration, we looked at how you can create feeds with Analytics for IoT.  Feeds are ways for you to consume real-time data sources to be visualized on a map and used in analysis workflows.  We connected to a source of data for real-time vehicle locations coming from an AVL solution.  In addition to showing the vehicle's location, we can also show historical tracks, the vehicle's direction, as well as driver information like their name and contact information.

         Feeds can be created for numerous types of data including but not limited to vehicles, SCADA, weather, and much more.  You can use feeds to make your maps live, integrate many data sources, and get a greater awareness of your operations. 

Analyze Worker Driving Patterns in Real-time

Route Deviations

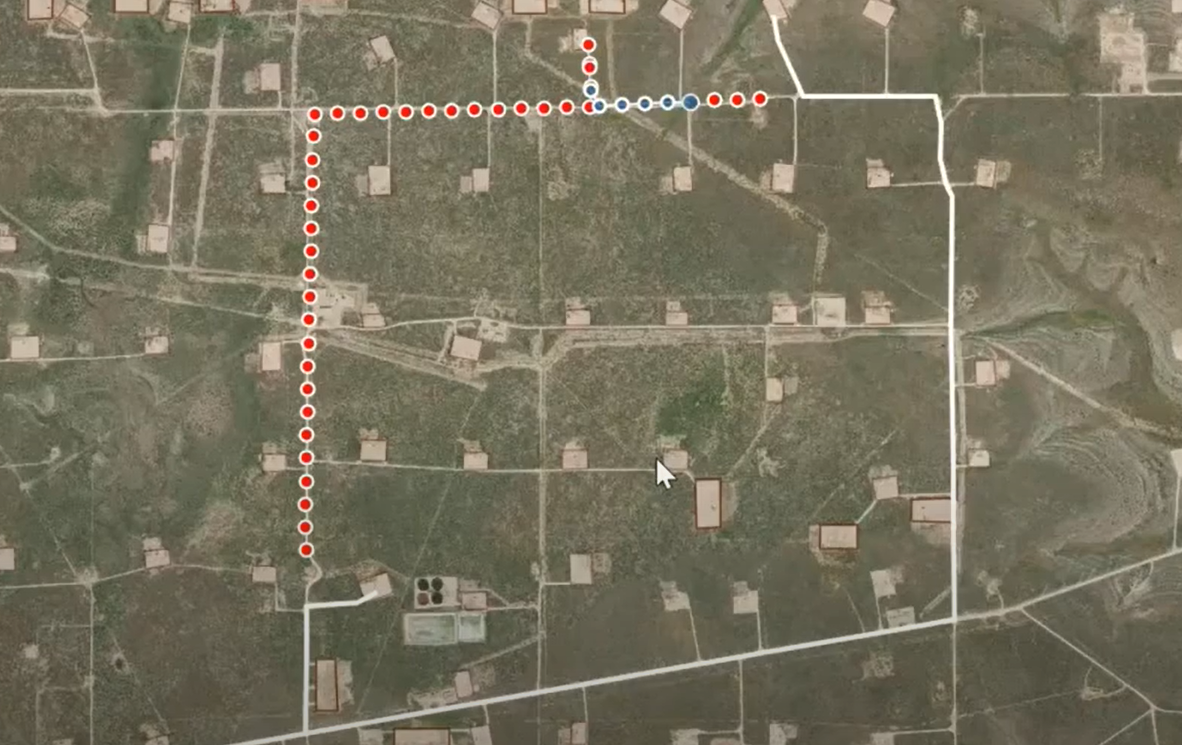
         Using real-time analysis, you can gain insight into the efficiency of your operations.  In the webinar, we looked at an example using the vehicle GPS feed that we created.  We added a layer for each workers' optimized driving route.  We wanted to compare the driver location against their optimized routes to find when they deviated from the optimized routes.  The output shows us every location where drivers made route deviations.  This same tool can be used to identify high-speed events for health and safety purposes or to identify the nearest employee to correct an issue coming from a SCADA system.  Or you could use well pads as geofences to identify where employees are or which ones are currently driving.

         Implementing route optimization tools can help you to reduce transportation costs and overall operating expenditures.  Analytics for IoT can help you to analyze your work patterns to maximize efficiency and identify opportunities for more improvement.

Proactively Respond to Weather for Health and Safety

Weather and Assets

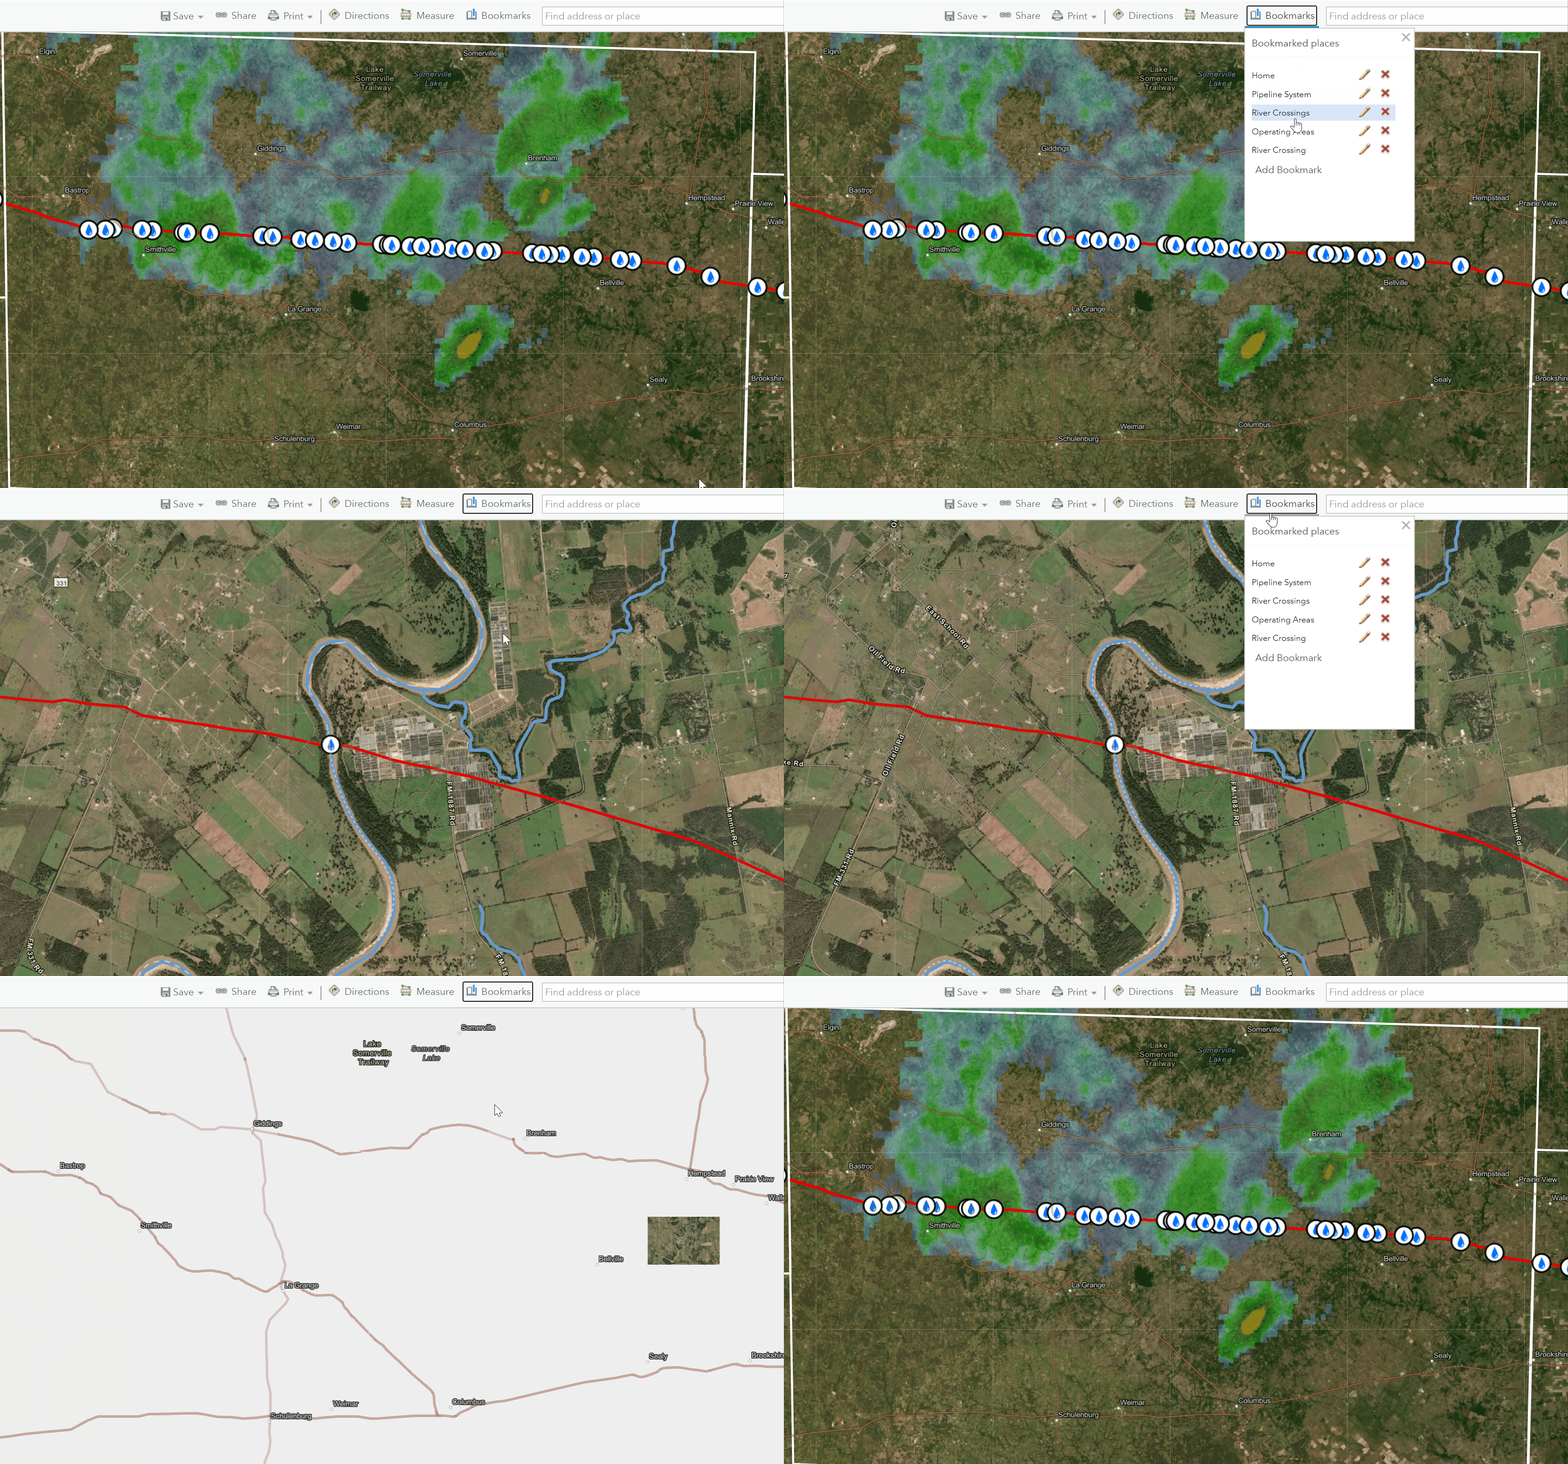
         At any point in time, potentially impactful weather events might be occurring near your operations.  A heat advisory could be impacting the health and safety of employees. For pipeline operators, a flooding event might be increasing the risk of channel erosion at stream or river crossings.  You can use Analytics for IoT to identify high-risk channel erosion events so that you can respond proactively by inspecting the stream or river crossing.  You can run this analysis every 15 minutes using live weather data to always be aware of the events impacting your operations. 

Site Visit Analysis with Vehicle GPS Tracks

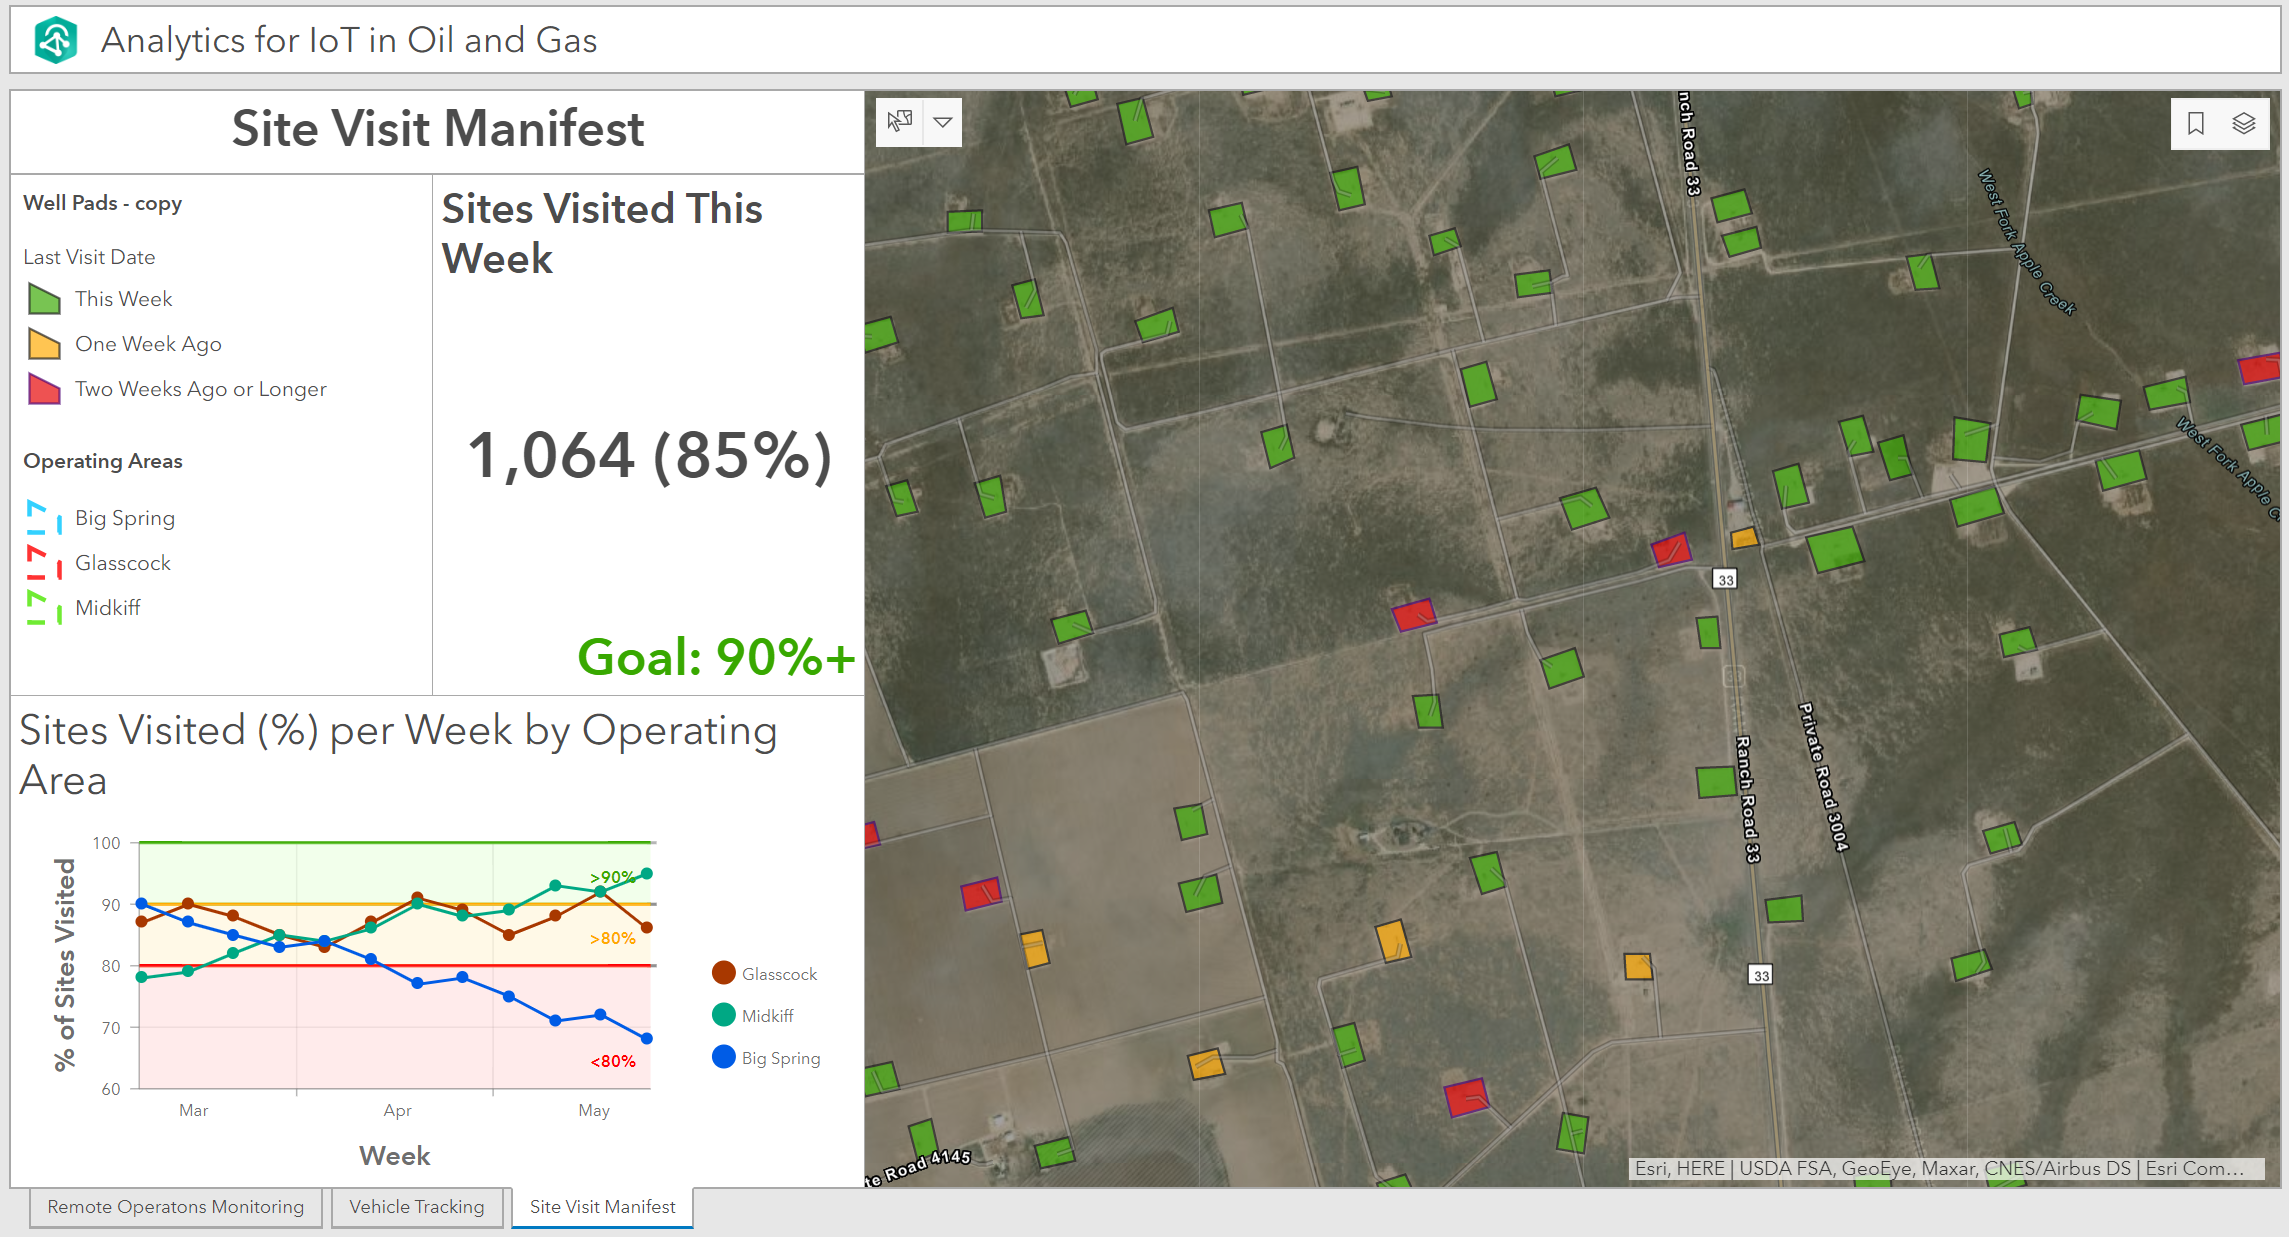
Site Visit Analysis         We analyzed millions of historical GPS locations from an AVL solution to identify assets that haven't been visited in a certain amount of time.  Well pads that were visited greater than two weeks ago are symbolized as red indicating they need to be visited.  We calculated the % of facilities being visited and compared it against our goal fo visiting 90%+ of our assets every week.  This analysis is automated and executed in the cloud every night so that the statistics can be visualized on the dashboard for managers. 

         You can use this to understand workforce capacity, ensure that work is being conducted as needed, identify areas where more resources are required.  Inspecting all facilities is critical for making sure that there are environmentally safe and functioning efficiently.  Analytics for IoT can help you ensure all facilities are meeting those goals. 

more
1 0 2,581
GeoffWade
Esri Contributor

It was great to see such a strong turnout of O&G oriented geospatial professionals at the annual ePUG meeting in London recently; kudos to the ePUG Committee on executing such a professional event, full of quality presentations, many of which are now posted at: https://goo.gl/U3Hvaj

The topics covered varied from Digital Transformation to Complex data-types, Big Data Capabilities, Mobility, Analytics and AI/ML integration points with Python, R, Tensor Flow, etc for work with Real-Time SCADA and Imagery. I especially enjoyed the presentations by Shell on Digital Transformation, BP on developing a professional spatial discipline, Addax on moving to the cloud, OSRL on Oil Spill Contingency Planning, etc. It was also tremendously pleasing to see the progress that many organizations have made with Information Portals, the excellent work and presentations of the OGA, NPD and BP all pointed to this.

With Best Wishes for a Very Happy New Year.

Geoff Wade | Petroleum Community Outreach - Esri

more
0 0 1,228
ValerieCoffin
Esri Contributor

Network, collaborate and learn from the Petroleum GIS Community

The Esri Petroleum GIS Conference, London, brings together thought leaders from the petroleum, gas, pipeline, and GIS user community in an interactive environment that fosters exploration, collaboration, and innovation.

The conference offers opportunities to:

  • Share industry success stories and best practices
  • Attend groundbreaking GIS solutions sessions
  • Connect one-on-one with Esri tech experts
  • Explore and test-drive ArcGIS with expert-led training at the Hands-On Learning Lab
  • Network and collaborate with industry peers to drive GIS development

Don’t miss this valuable experience to grow your professional network, GIS skill set, and opportunities for success in 2018!

Register Today

Call for Papers Extended!

Lead the Way and Become a GIS Thought Leader. The success of the Esri European Petroleum GIS Conference depends on users like you, getting involved and sharing knowledge, best practices, and real-world experiences.

When you present a paper, your peers see you as a thought leader and a direct contributor to their achievements. Now's the time to lead the way! 

This year's Conference is focused on the following areas:

Technology AreasBusiness Areas
ArcGIS in the CloudUpstream – Exploration, License Management, Operations/Production (eField)
Technology TrendsMidstream - Pipeline, Integrity Management and Risk
Big Data and Spatial Data ManagementDownstream - Refining, Distribution and Retail
 Internet of Things (IoT)Health, Safety, Security and Environment
 Machine Learning and Data Science Decommissioning
Geoscience Workflow SupportRenewables
Applications Integration Marine Sciences/Activities
 Mobility

Submit an Abstract

more
0 0 1,208
ValerieCoffin
Esri Contributor

Esri Answers the Call for a Pipeline Industry Event


We invite you to one of two Esri Pipeline Events this fall. At these exclusive events, you will see firsthand how GIS technology can improve your bottom line by increasing communications, driving greater efficiencies, and empowering analysis and insight for smarter decision-making.


You and the other attendees will:

  • Get a guided look at Esri's latest technology, with demonstrations outlining pipeline-specific workflows and a focus on common patterns of GIS use, including mapping and visualization, data management, field mobility, monitoring, analytics, decision support, and sharing and collaboration.
  • Have the unique opportunity to network, collaborate, and exchange ideas and best practices with your industry peers, face-to-face, in a thought-provoking atmosphere.
  • Have the opportunity to explore solutions provided by Esri partners and discover how they are adding value to pipeline operators using the ArcGIS platform.

There will be two opportunities to attend. 

Houston Pipeline EventDenver Pipeline Event
September 11-12 October 3
Register for the Houston event today!Register for the Denver event today!

more
3 0 1,982
ValerieCoffin
Esri Contributor

Thanks to the input and participation of the Esri Petroleum Users Group, this year's conference was a terrific success! Over the two-day conference attendees had the opportunity to network with 1,200 of their peers, view 37 user presentations on the latest and greatest solutions in the industry, attend 38 technical workshops, and saw firsthand how GIS solutions can drive your location strategy forward to help you increase productivity and reduce costs within your organization.

We are now pleased to announce the proceedings from the 2018 Esri Petroleum GIS Conference in Houston:

  • Highlights from the conference can be found on our new Petroleum community GeoNet blog. Be sure to sign up and stay connected with us throughout the year!
  • Discover the broad spectrum of technology and solutions Esri has to offer with the full video playlist of the conference Plenary Session. 
  • Explore over 60 exceptional user presentations and technical workshops built to solve the industries greatest challenges, and learn from thought leaders who have walked in your shoes.
  • Over 1,200 industry peers come together to collaborate and share, learn, and network at this annual event. Take a brief tour of the conference through the photographic lens.
  • Finally, we invite all of you to participate in the PUG Professional Salary Survey.

Next year’s conference is set for May 15-16, 2019 in Houston. Stay tuned for your exclusive invitation!

more
0 0 1,826
ValerieCoffin
Esri Contributor

Esri Petroleum GIS Conference attendees discovered new ways to get business intelligence from their data, that drives planning and delivers greater profits.

The trendy words that buzzed around the halls of the Esri Petroleum GIS Conference 2018 came attached to data and lots of it: Big Data, Analytics, Digital Twin, IoT, AI . . . evidence that the industry is transforming itself through connected systems that extract business value from digital data. This data is building the muscles of the beleaguered O&G and pipeline industry and helping it climb out of a 4-year lull. More than 1100 attendees came to Houston this May, and were intensely focused as they explored new methods and technologies that would support their companies’ geospatial needs well into the future.

Chevron Map HubDuring the plenary, Esri handed the mic to petroleum company leaders who described how their enterprise digital transformation strategies and modernized methodologies were giving their companies an edge. For instance, Chevron demoed the newly launched Chevron Map Hub. Nearly 2500 employees use a combination of ArcGIS Enterprise and managed cloud services to easily find and access enterprise data, and perform cross-functional data analyses. Other companies explained how they had aligned their location strategies with their companies’ objectives in areas of mobility and operational efficiency.

Esri demoed the latest technical capabilities added to its ArcGIS platform. For instance, ArcGIS Indoors is a new facility operations management tool, that optimizes workspace for better collaboration and asset inventory management. ArcGIS Monitor manages and monitors enterprise server deployments diagnoses, heals and improves performance. The Seneca GIS team demoed how it is using the ArcGIS Workflow Manager web tool to help manage and monitor the company’s development projects and respond quickly to hiccups that could cause delays.

HUBUB about the road ahead

Maximize ImpactSome attendees were new to the conference while others had been coming for more than 20 years. They compared notes about GIS experts’ roles have changed in their companies due to the growing capabilities of GIS. The platform has become a self-service mapping system for staff throughout the enterprise and some traditionally ‘non-GIS departments’ are now building their own GIS apps. This freedom has opened opportunities for GIS experts to take on the roles of innovation champions and technology leaders.

GIS managers shared how they have been included in high-level planning meetings with company leaders and have become very much involved in high-level decision-making. They are a part of designing location strategies that derive value from the technologies. Attendees were encouraged to raise the scope of their vision to the enterprise scale, as they develop location strategies that improve the effectiveness of the workforce, provide business intelligence for decision making, and connect their companies with customers.

Representatives from oil, gas, and pipeline companies provided 40 user presentations ranging from subsurface analysis to satellite imagery interpretation. Many shared best practices showing how enterprise-level web technologies have changed their approaches and that they were saving their companies millions of dollars. In the next few weeks, these talks will be posted under preceding’s on the Petroleum GIS Conference page.

Esri and partners presented 18 technical sessions and attendees tried out solutions in the hand-on learning lab. In the GIS Solutions EXPO hall, 50 vendors provided insight into their products and services. The 14 sponsors who made this event successful helped keep registration costs down and provide meals and various social events, including the popular PUG evening social.

PUG social PUG social

The Petroleum User Group - PUG

The Conference’s final session was the PUG Steering Committee meeting. Comprised entirely of petroleum GIS users, the committee helps direct the Esri development team by providing recommendations for product enhancements that meet the O&G and pipeline industries’ most pressing needs. PUG asked Esri to help standardize a set of common workflows that can be used across the industry. Users can participate in creating these opensource workflows by submitting their workflows via Linkedin @pugonline.

The committee also shared concerns about the decrease in qualified geospatial technology staff. Where have they gone and how can we get them back, now that the industry is an upswing? GIS experts are looking for new opportunities and students are considering the field. To build career information and raise the aspirations of those considering a GIS career in O&G, PUG is hosting a survey that will provide the community insight into compensation as it relates to education, roles, and responsibilities. Please do spend a few minutes to complete the confidential salary survey.

Esri announced that it has re-launched the GeoNet Petroleum page, which offers another way for customers, partners, distributors, staff and others in the GIS and geospatial professional community to connect, collaborate, and share ideas. This one-stop resource center is a place to discuss topics and collaborate; ask questions and get answers; read the latest blogs and follow the various social media channels, including the Twitter feed. Connect with GeoNet.

more
2 0 2,612
56 Subscribers