- Home
- :
- All Communities
- :
- User Groups
- :
- New to GIS
- :
- Questions
- :
- Shapefile displaced to south pole
- Subscribe to RSS Feed
- Mark Topic as New
- Mark Topic as Read
- Float this Topic for Current User
- Bookmark
- Subscribe
- Mute
- Printer Friendly Page
- Mark as New
- Bookmark
- Subscribe
- Mute
- Subscribe to RSS Feed
- Permalink
Hello community,
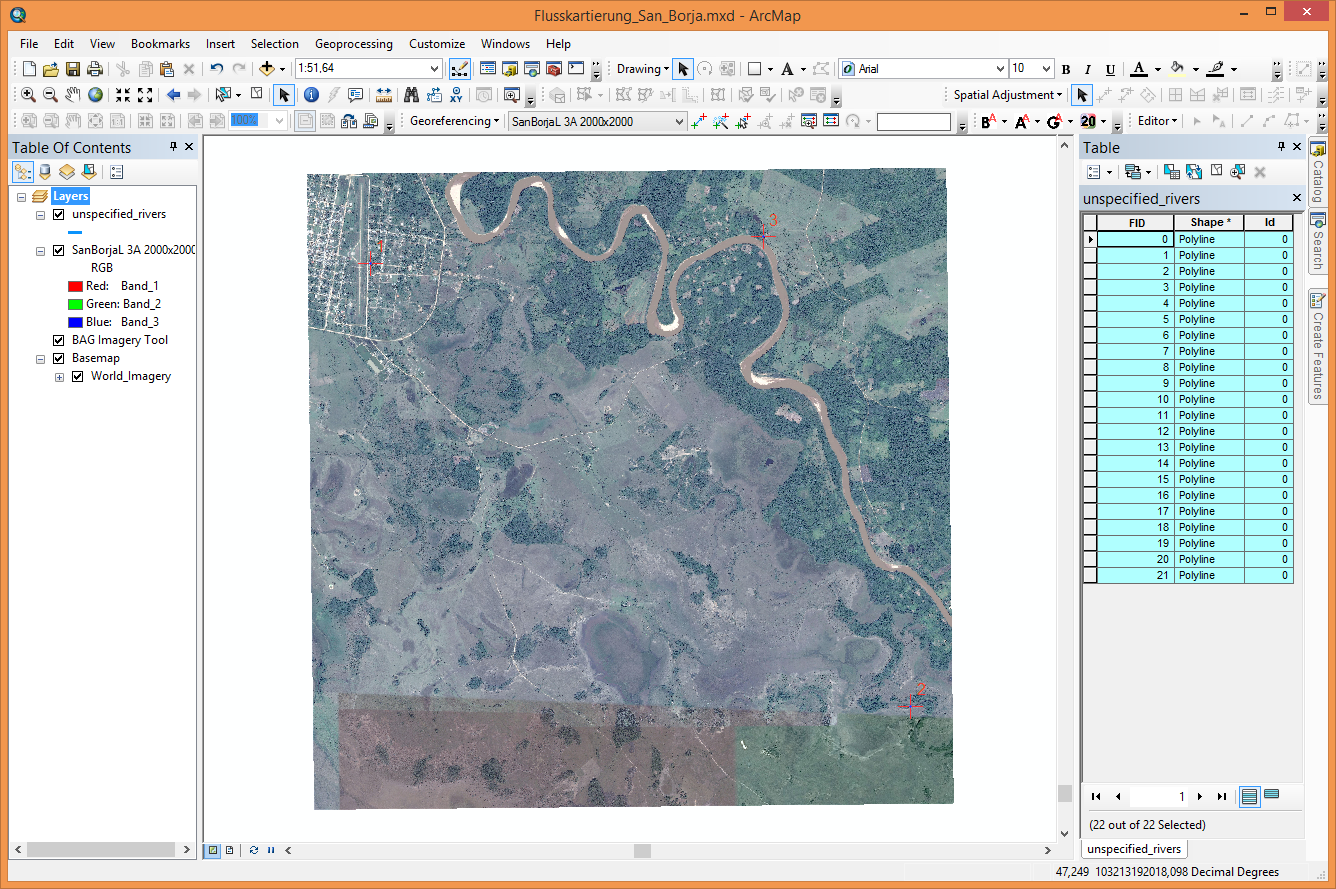
I am a Geography student and very new to ArcGIS. Back in August I started a project which asked of me as one of the project tasks to map some paleorivers in Bolivia. So I got into ArcGIS a little and started the work. That worked pretty well and decided to work on other project tasks before continuing my GIS work. When I opened up my ArcGIS project again last week the features I created back then were all moved south of the south pole. Let's look at some screenshots.
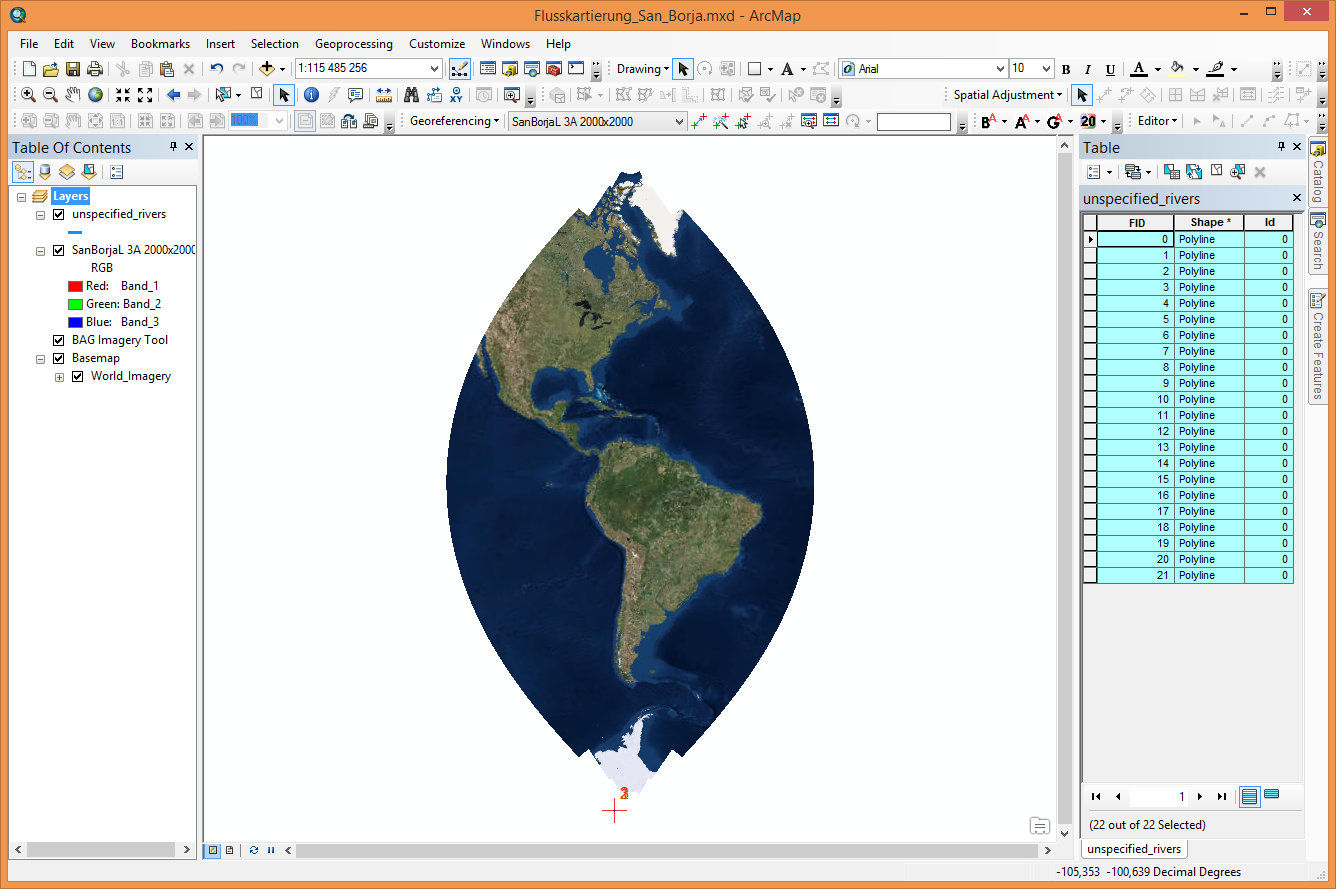
This is where the rivers and the reference image both map: south of the south pole (where the red cross with the "3" are)
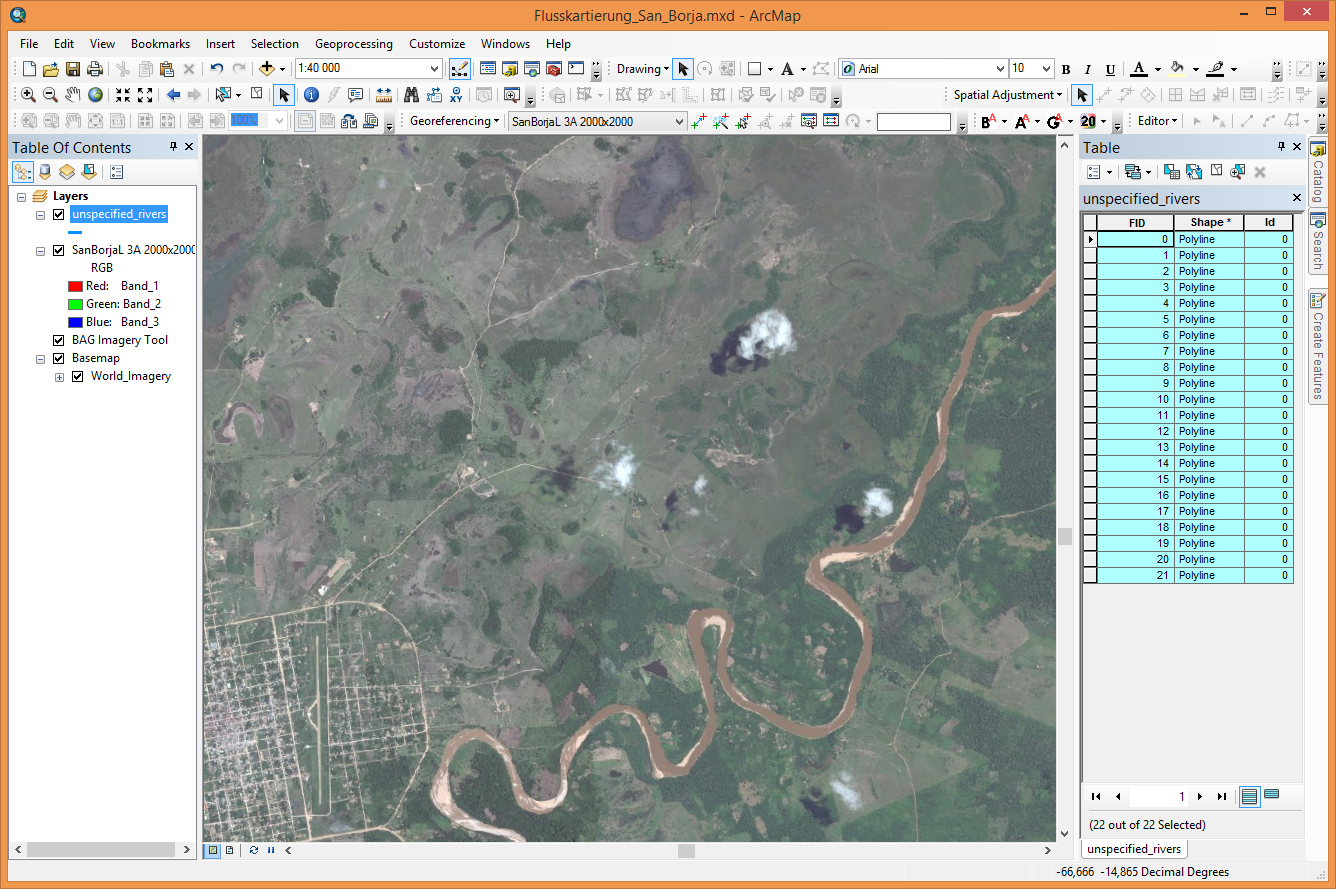
This is a zoom on the desired area. Clearly, there are no lines shaped here.
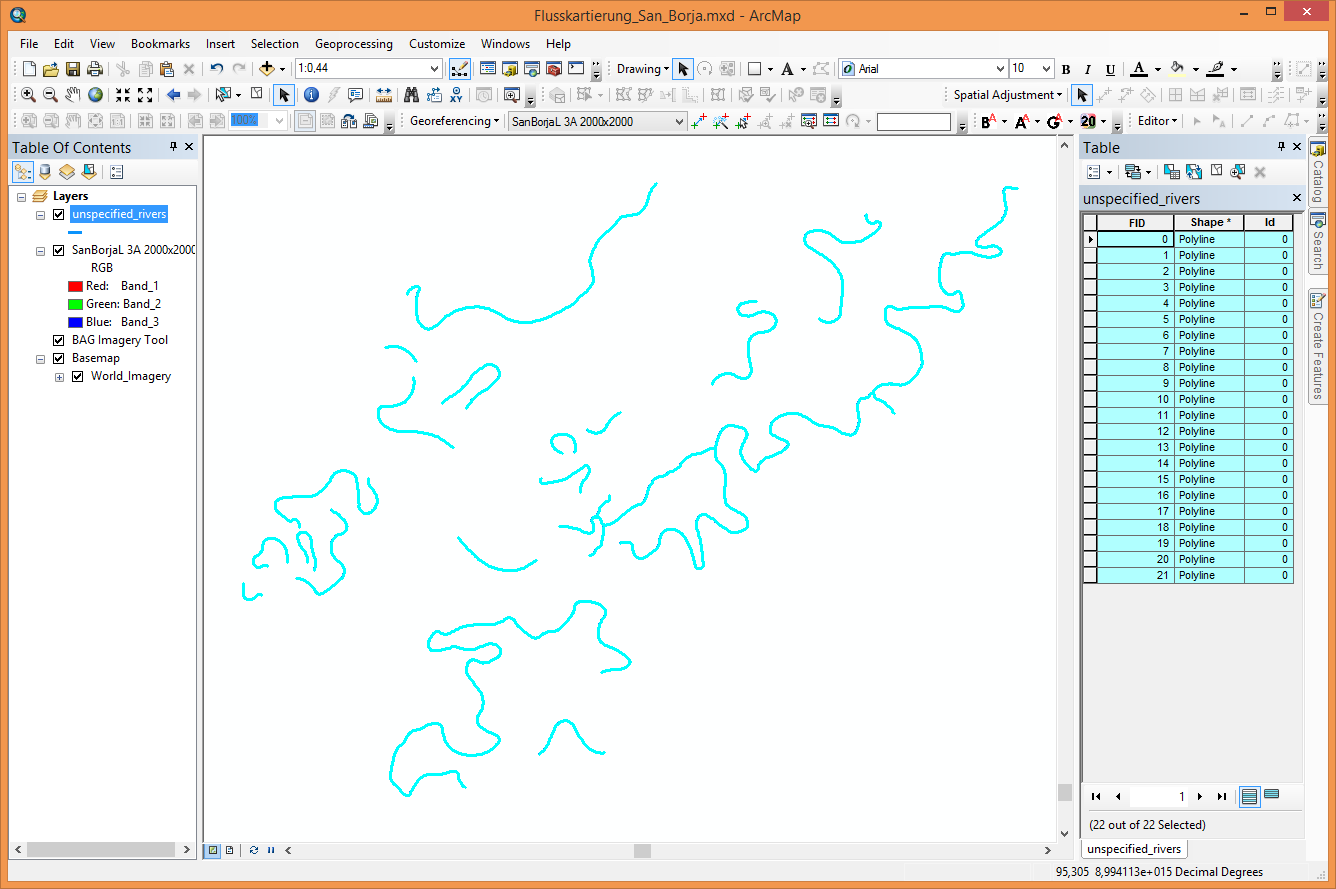
Those are the lines I drew back in August. They match some paleoriver beds in the map above, but are not shown on the map any more. Look at the display scale, it reads "1 : 0,44" which means that they are displayed smaller than the feature in real life. Of course, this is rubbish, as the displays scale in the first image is 1:40'000.
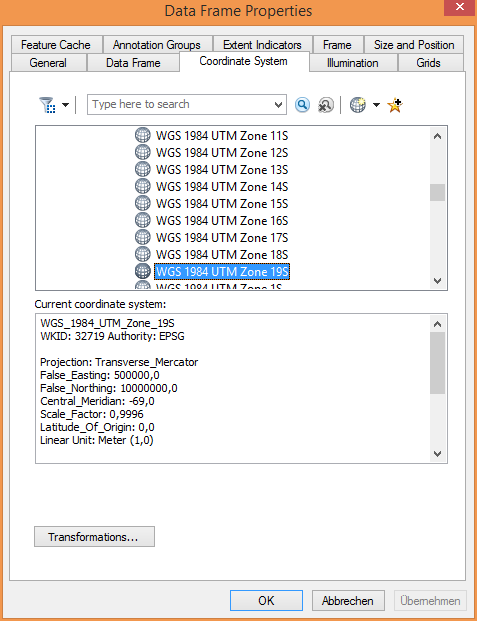
When I right-click on "Layers" and go to "Properties" and then "Source" everything seems correct. UTM Zone 19S is the required projection within which I was asked to work. I shouldn't change that.
When I started in August, I opened ArcMap and opened the basemap layer, set the coordinate system of the "Layers" to UTM 19S and found some tutorial on creating a shapefile from scratch, which I followed and image 2 was the result so far, only that it was showing at the correct location back then.
I don't really need any basemap that is provided in ArcGIS, though. The work I am doing requires me essentially to import an image into ArcMap, georeference that image in the right coordinate system, and then map the rivers on that image.
Since that image is not any different from the utilised basemap so far, it would still be nice to know what went wrong.
Here's more:
This is what I obtain from a right click on "unspecified_rivers" > "Properties" > "Source"
| Data Source | Value |
|---|---|
Data Type: | Shapefile Feature Class |
| Shapefile: | D:\GIS_maps\San_Borja_RF\unspecified_rivers.shp |
| Geometry Type: | Line |
| Coordinates have Z values: | No |
| Coordinates have measures: | No |
| Projected Coordinate System: | WGS_1984_UTM_Zone_19S |
| Projection: | Transverse_Mercator |
| False_Easting: | 500000,00000000 |
| False_Northing: | 10000000,00000000 |
| Central_Meridian: | -69,00000000 |
| Scale_Factor: | 0,99960000 |
| Latitude_Of_Origin: | 0,00000000 |
| Linear Unit: | Meter |
| Geographic Coordinate System: | GCS_WGS_1984 |
| Datum: | D_WGS_1984 |
| Prime Meridian: | Greenwich |
| Angular Unit: | Degree |
Following an image on the image I should use:
I georeferenced some points by right-clicking on the crosshairs and then putting in the X and Y-values I got from this Image:
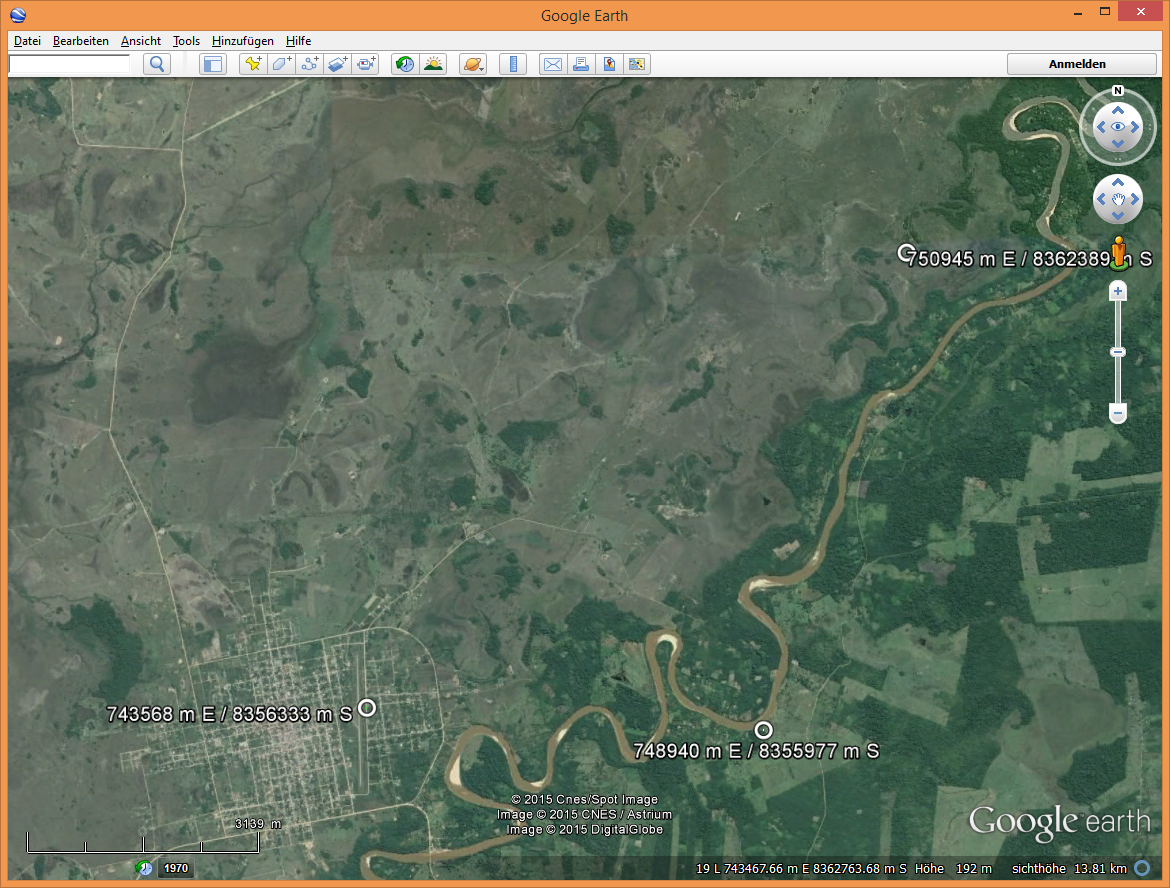
You can see on this image, that we are in the sector "19 L" at 743 km East and 8362 km South. Now, what I noticed is that as the longitudinal information may be correct, the latitudinal is measured from the South Pole, or more exactly 2000m south of the South Pole, because as you travel south, the numbers decrease but never under a value of 2000m.
This is the link table of the control points as I entered them 2 hours ago:
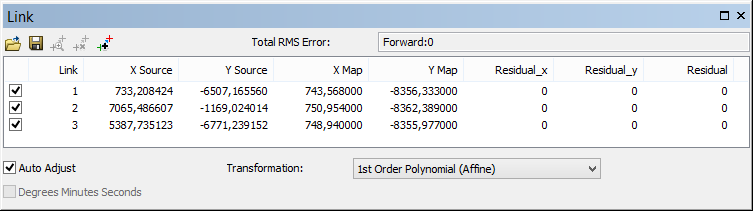
As you can see, the numbers match those in the Google Earth image and I entered the Y-coordinate with the negative algebraic sign, because I thought it measured from the equator. Still, I tried to flip the minus to positive in the link table and the reference image didn't really move anywhere north of the South Pole.
Just ask, if you need any more information. In the meantime, I will start over and this time start with the reference image and then draw the lines.
I am excited to see your answers. Please promote this thread to anyone you think might know what mistakes I made while working on this project. You may, of course, also only answer to one of the presented problems. Any insight is appreciated.
Cheers,
Benny
Solved! Go to Solution.
- Mark as New
- Bookmark
- Subscribe
- Mute
- Subscribe to RSS Feed
- Permalink
Hi Melita Kennedy, it is very kind of you that you want Todd to have the points, but I strongly advise not to change the correct answer. You deserve the recognition that you received, but more importantly, the correct answer is the one other users stumble upon and should be easily recognizable. When it comes to points, a helpful is as valuable as a correct answer. If you haven’t done so, you could mark Todd’s answer as helpful.
Kind regards, Xander
- Mark as New
- Bookmark
- Subscribe
- Mute
- Subscribe to RSS Feed
- Permalink
Chamged it anyways, since Todd's answer is actually what I was looking to do. Like you mentioned correctly, if people are reading through my question and have just that problem, Todd's answer will help them. In his answer, there is "like Melita said", so they'll go find what Melita said. I think this will help more people than what I did before. Otherwise people might not read all the answers and leave frustrated, opening another post on the same matter, wasting their own and the respondents' time, since they will already have answered the same question already. 
Anyways, I'll go do some measurements, now.
Benny
- « Previous
-
- 1
- 2
- Next »
- « Previous
-
- 1
- 2
- Next »