- Home
- :
- All Communities
- :
- Developers
- :
- Native Maps SDKs
- :
- .NET Maps SDK Questions
- :
- Native memory leak in PictureMarkerSymbol.SetSourc...
- Subscribe to RSS Feed
- Mark Topic as New
- Mark Topic as Read
- Float this Topic for Current User
- Bookmark
- Subscribe
- Mute
- Printer Friendly Page
Native memory leak in PictureMarkerSymbol.SetSourceAsync()?
- Mark as New
- Bookmark
- Subscribe
- Mute
- Subscribe to RSS Feed
- Permalink
Good afternoon,
I've been trying to debug some private byte allocation leaks in my application and finally think I've narrowed it down to the PictureMarkerSymbol.SetSourceAsync() method.
My use case consists of updating n number of PictureMarkerSymbol sources/geometries on the map once every ~100ms. Through a combination of Redgate, WinDbg, and ultimately DebugDiag I pinpointed the culprit (I think) to RuntimeCoreNet calling into msvcr120::malloc.
I'm setting the source of my PictureMarkerSymbols like this:
private async void periodicUpdate()
{
BitmapFrame frame = BitmapFrame.Create(this.someBitmapSource);
PngBitmapEncoder encoder = new PngBitmapEncoder();
encoder.Frames.Add(frame);
using (Stream stream = new MemoryStream())
{
encoder.Save(stream);
stream.Seek(0, SeekOrigin.Begin);
await this.pictureSymbol.SetSourceAsync(stream);
}
}
Has anyone else encountered this issue? Am I setting the source incorrectly or otherwise missing something else? The leak seems to be pretty linear in growth and will generate an OutOfMemoryException fairly reliably.
- Mark as New
- Bookmark
- Subscribe
- Mute
- Subscribe to RSS Feed
- Permalink
It's worth noting that I'm seeing the same behavior (linear private heap allocation increase) when setting the source using the synchronous method and a byte array.
- Mark as New
- Bookmark
- Subscribe
- Mute
- Subscribe to RSS Feed
- Permalink
Hi Aaron,
Please can you add a small repro app which demonstrates the issue you are seeing?
Cheers
Mike
- Mark as New
- Bookmark
- Subscribe
- Mute
- Subscribe to RSS Feed
- Permalink
Was there any resolution to this? I believe I'm seeing the same thing. I use multiple PictureMarkerSymbols on my map and I have started to notice a similar result. It happens gradually, but runs out of memory over a few hours.
- Mark as New
- Bookmark
- Subscribe
- Mute
- Subscribe to RSS Feed
- Permalink
Hi Clay,
I wasn't able to reproduce any issue using the repro case above recompiled for v100.1. Again, the memory profile stays pretty stable, rising to approx. 200 within the first 5-10 seconds then staying level.

I am very keen to get another repro case if you have one.
Cheers
Mike
- Mark as New
- Bookmark
- Subscribe
- Mute
- Subscribe to RSS Feed
- Permalink
Hi Aaron,
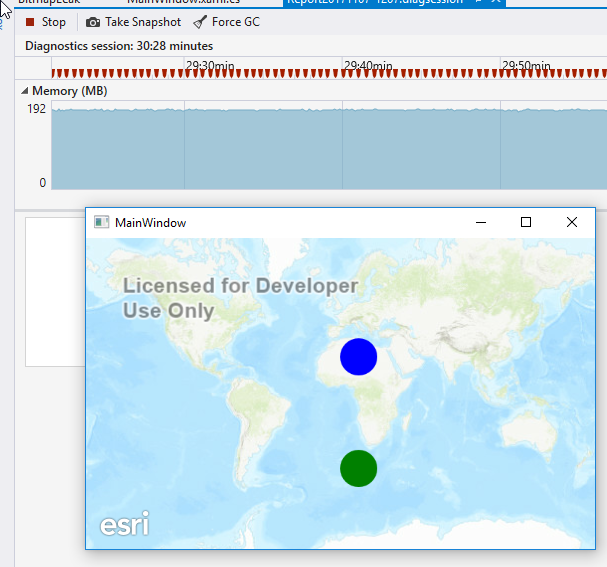
Thanks for the excellent repro app. Unfortunately I am unable to the memory growth you were seeing with the 10.2.7 release. The memory profile actually looks very stable - your repro has been running for almost 30mins: memory climbed to 192MB after 5 seconds and stayed at that level.

Cheers
Mike
- Mark as New
- Bookmark
- Subscribe
- Mute
- Subscribe to RSS Feed
- Permalink
I've started running into a similar problem, with similar results: Aaron High's repro app was running fine for me despite me seeing an issue in a larger application.
I was able, however, to make a small change to Aaron's demo that results in the app consistently and quickly crashing for me (attached). The change is to increase the number of graphics objects being drawn. On my computer, the attached code begins to misbehave almost immediately. On a coworker's (newer) computer, he had to increase the graphics count to 1000 before the app would crash within a few minutes.
Both computers are running Windows 7, 64-bit, using version 10.2.7 of the runtime.