- Home
- :
- All Communities
- :
- Products
- :
- ModelBuilder
- :
- ModelBuilder Questions
- :
- Re: Speeding up finding the minimum point
- Subscribe to RSS Feed
- Mark Topic as New
- Mark Topic as Read
- Float this Topic for Current User
- Bookmark
- Subscribe
- Mute
- Printer Friendly Page
Speeding up finding the minimum point
- Mark as New
- Bookmark
- Subscribe
- Mute
- Subscribe to RSS Feed
- Permalink
I am trying to get the point of the lowest elevation within a series of polygons (see attached). However, it seems to take nearly a minute for one point to be created. I've tried to speed this up by extracting the elevation just within the buffers for analysis and to reduce data size. I've also set the environment to the polygon that is being iterated on. Any suggestions?
- Mark as New
- Bookmark
- Subscribe
- Mute
- Subscribe to RSS Feed
- Permalink
Dan, please see the figure I've included in response to Abdullah's first comment.
- Mark as New
- Bookmark
- Subscribe
- Mute
- Subscribe to RSS Feed
- Permalink
http://www.arcgis.com/home/item.html?id=b859b33c616a47d2b99b5e133942db02 takes care of the overlaps
but that still doesn't answer my elevation question, but in any event, if you polygons are real small, it isn't going to matter much whether you get 1 or 100 points
- Mark as New
- Bookmark
- Subscribe
- Mute
- Subscribe to RSS Feed
- Permalink
Dan is right, Why do you need iteration?
Zonal Statistics tool has zone field (Field that holds the values that define each zone).

- Mark as New
- Bookmark
- Subscribe
- Mute
- Subscribe to RSS Feed
- Permalink
Abdullah, I need iteration for for cases where polygons over lap such as those below. There are four polygons. I need a minimum value for each polygon/zone. If I use Zonal Statistics in one go, the raster that is output is would contain the minimum found between both zones in the overlapping area. I want to avoid that.
- Mark as New
- Bookmark
- Subscribe
- Mute
- Subscribe to RSS Feed
- Permalink
Did you try to change environment to extent and snap to polygon?
see below picture
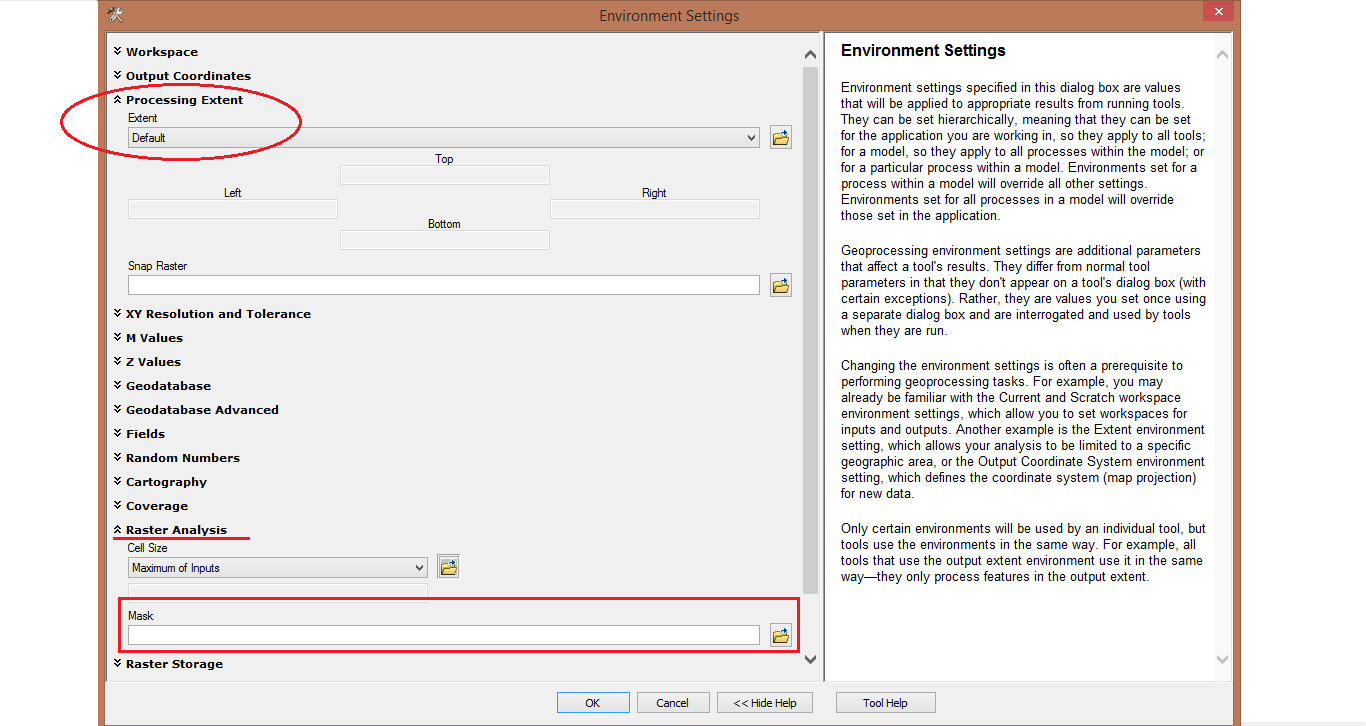
change Mask to be the same polygon feature .
- Mark as New
- Bookmark
- Subscribe
- Mute
- Subscribe to RSS Feed
- Permalink
Within Model Builder, I have done that by creating dashed lines between the Polygon(i) to Raster Calculator setting Extent & Mask to that of Polygon(i). I'm assuming this would iteratively set the Extent and mask to match each subsequent Polygon. It still seems relatively slow.
Is there anyway to store the results of Zonal Statistics in memory opposed to writing it to a file? I would think that would speed it up considerably.
One alternative I have tried using the table tool is: using Zonal Statistics as Table, Joining output Table on OID (unique identifier) to Polygons, then outputting a new Feature Class. Then, using the new Feature Class, using Get Field Value on the minimum value trying to pass that to Raster Calculator, but it always fails.
- Mark as New
- Bookmark
- Subscribe
- Mute
- Subscribe to RSS Feed
- Permalink
I have had to deal with this problem in the past. The polygon coming out of the iterator needs to be used to define the environment setting processing extent for your zonal stats tool as well as the raster calculator tool which I assume is extracting a single cell out by attribute.
Probably the easiest way is to copy polygon(i) into a temporary featureclass using the copy feature tool. This would then be a dataset containing one feature and the extent of that dataset would be that feature. You could then simply join that to the zonal stats tool as an environment setting as well as your raster calculator.
So edit your model so polygon(i) feeds into a copy features tool and let that be the extent environment setting property of the zonal stats tool and raster calculator.
- Mark as New
- Bookmark
- Subscribe
- Mute
- Subscribe to RSS Feed
- Permalink
question also appears here perhaps moving on
- Mark as New
- Bookmark
- Subscribe
- Mute
- Subscribe to RSS Feed
- Permalink
John,
I wrote the following a couple years ago, and just tried generalizing (removing project specific information) this morning. If you can dive into python then it may be helpful, I'll post it separately also for the python people out there. The problem I had was I was making mapbooks, and wanted to give the user some sense of the elevations across the page, but I didn't want contours because they can get ugly and it is a slippery slope of editing, and I tried a color shaded relief but there were separate issues with generating that. So I ended up writing a script that found the min/max elevation within each mapbook page, i.e. spot elevations. Not only does it find it within the extent of the page, but it also gets the min/max within a sub-grid of the page and it only looks within an internal (negative) buffer of the page extent. The logic being you don't want to symbolize point elevations on the edge of the page, and if the min/max is on edge of the page then you'd likely get duplicate points in many locations.
It essentially converts the raster to a numpy array, uses numpy to get the relevant value and then spits back out the min/max points. I designed it for a grid, if you have irregular polygons it might need to be modified, e.g. some sort of mask applied. I haven't tested this, so just take it as 'inspiration'. So with those caveats see below,
Thanks
George
Edited: Removed inline code, and attached python script that I got working. Attached python script can be used directly or as inspiration for calculating point elevations within a set of gridded polygons. It will likely require modification if the polygons are not in a gridded format. It is intended for loading within the ArcMap python window and was tested with WGS84.img raster (default install in ArcMap) and the georef15 shapefile (default install in ArcMap). User needs to create a feature class or shapefile prior to running the tool to hold the output spot elevations. The output fc shouhld have a field that matches a uniqueID/name of the input polygons (in the case of georef15 I used 'Code'), a field for output Elevation (default 'Elevation' type double), and a field for the extrema type (default 'Extrema' type string length 3). Options include the ability to do a negative buffer in percent (default 0.05, min is 0, max is 0.49999...) and to use a subgrid within the polygons (default is 2 so a 2x2 subgrid, change to 1 if you just want min/max within the original poly).
Call the function with the arguments, example:
createSpotElevations('WGS84.img','georef15','SpotElevations','Code',gInsideBufferFactor = 0, subgridSize = 1)
Good Luck.
George
- « Previous
-
- 1
- 2
- Next »
- « Previous
-
- 1
- 2
- Next »