- Home
- :
- All Communities
- :
- Products
- :
- Mapping
- :
- Mapping Questions
- :
- Rainfall erosivity map preparation
- Subscribe to RSS Feed
- Mark Topic as New
- Mark Topic as Read
- Float this Topic for Current User
- Bookmark
- Subscribe
- Mute
- Printer Friendly Page
Rainfall erosivity map preparation
- Mark as New
- Bookmark
- Subscribe
- Mute
- Subscribe to RSS Feed
- Permalink
I am trying to develop rainfall erosivity map over a study area using 30yrs period rainfall data. i have determined the R for each year, rainfall erosivity for each year, how do i use this to prepare a map showing the rainfall erosivity for the entire study area.
- Mark as New
- Bookmark
- Subscribe
- Mute
- Subscribe to RSS Feed
- Permalink
basic mapping, if erosivity is associated with a specific surface type. In order to map an attribute you need to associate it with space via a surrogate attribute is a spatial attribute isn't used in its determination
- Mark as New
- Bookmark
- Subscribe
- Mute
- Subscribe to RSS Feed
- Permalink
the data was collected from a single station, i now have the location of the station and the elevation, the challenge is how to extrapolate this to cover an area of about 15000 ha. I have looked at the attribute s of a countrywide rainfall map and tried to see how i could use a surrogate attribute (if i am able to clip the study area out), but i dont see the possibility.
- Mark as New
- Bookmark
- Subscribe
- Mute
- Subscribe to RSS Feed
- Permalink
You can't extrapolate or interpolate...you can only assign the attributes to a boundary file covering your study area, perhaps by joining the attributes of your table to the table of the boundary file.
- Mark as New
- Bookmark
- Subscribe
- Mute
- Subscribe to RSS Feed
- Permalink
Or mine, this is the sort of missing link i have been looking for, i will try it and get back to you
- Mark as New
- Bookmark
- Subscribe
- Mute
- Subscribe to RSS Feed
- Permalink
i saved the excel file as a csv (ms-dos) document and opened it in arcgis.it had only two columns, the years and the R values. When i tried to join with a map of the watershed of the site all the figures were converted to <null> sign. I tried with a boundary shape file with same results. I even tried joining the tables in reverse order but the same results, and i think there is something very wrong with the result. Any suggestions?
- Mark as New
- Bookmark
- Subscribe
- Mute
- Subscribe to RSS Feed
- Permalink
You can join text fields to text fields and number fields to number fields... however, in either case the fields that are used in the join need to contain the same data, so if you want to join based on some class, both files need to contain the same classes
Perhaps some visuals from the help files will help Joining attributes in one table to another—Help | ArcGIS for Desktop
- Mark as New
- Bookmark
- Subscribe
- Mute
- Subscribe to RSS Feed
- Permalink
Dan Patterson, this is the latest on the rainfall erosivity map.
I now have data from 6 different stations within the study site, which i used to derive rainfall erosivity values for between 40-11years period. I used the addxy coordinates tool to locate the raingages in a map and using the feature to feature tool in arcmap converted the processed data in excel into a feature. I tried using the Spline approach to interpolate the erosivity values to cover the entire site, i also used krigging |
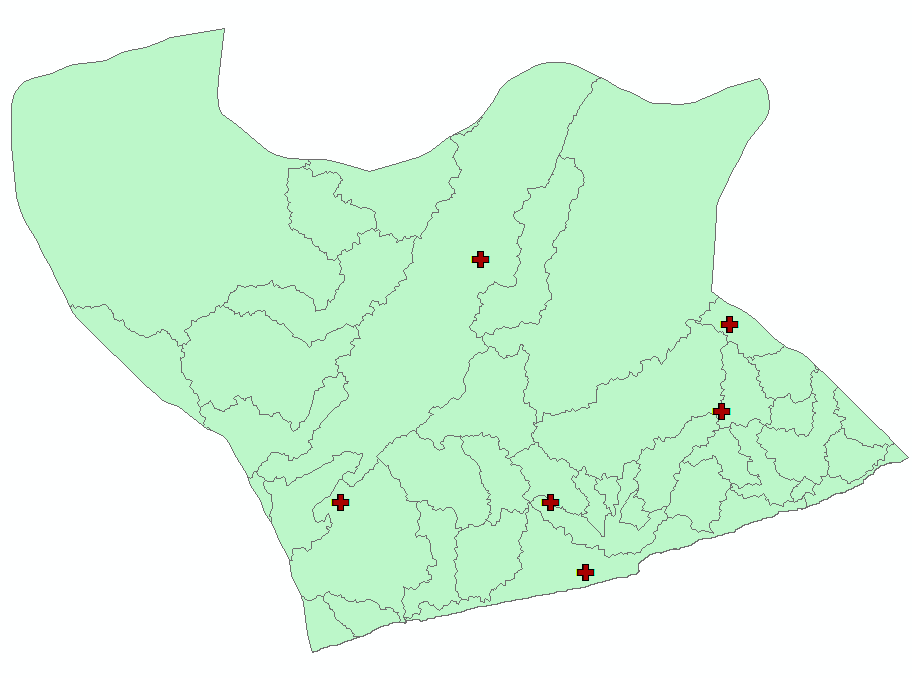
 but what i am getting is not what i want. How do i improve it. I am attaching two maps for clarification
- Mark as New
- Bookmark
- Subscribe
- Mute
- Subscribe to RSS Feed
- Permalink
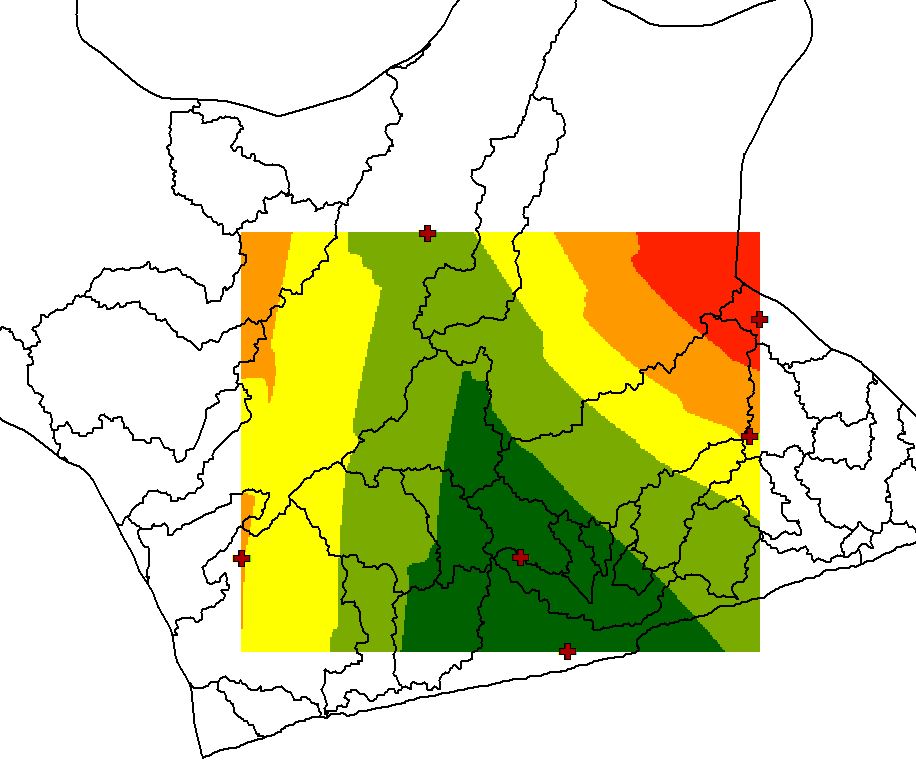
The first map shows location of raingages and the second results of spline, but which covers only limited part of site. How do i extent it to cover rest of site
- Mark as New
- Bookmark
- Subscribe
- Mute
- Subscribe to RSS Feed
- Permalink
Your extent was set by default, to the extent of the point layer. In order to get a larger extent, you have to set the extent properties in the Environments tab of the tool you are running. That will solve that problem. I will caution, however, that although you may have a minimum number of data points, there are vast areas for which there are no observations and the distribution could be described as poor. I would not put much faith in the pattern that you observe. It may look 'nice' when compared to simple point map, but the interpolated values could at best be described as potentially valid to completely wrong. What you have now, goes well beyond the mechanics of performing an interpolation, into the realm of whether you should be doing one in the first place. That decision resides with you.