- Home
- :
- All Communities
- :
- Services
- :
- Implementing ArcGIS
- :
- Implementing ArcGIS Questions
- :
- Minimum Bounding Geometry Irregular Polygon Length...
- Subscribe to RSS Feed
- Mark Topic as New
- Mark Topic as Read
- Float this Topic for Current User
- Bookmark
- Subscribe
- Mute
- Printer Friendly Page
Minimum Bounding Geometry Irregular Polygon Length & Width
- Mark as New
- Bookmark
- Subscribe
- Mute
- Subscribe to RSS Feed
- Permalink
Hi everyone,
First time poster. I am a student learning GIS and attempting to use it on a project I wish to pursue. It involves mapping many irregular polygon (couple of thousand). I need to be able to extract the length and width of the polygons to start with. I know I can get a length using geometry and then divide by 2 to get the average length.
I have been doing a lot of research online and have been attempting to use the bounding containers tool from data management. I am using ArcGIS 10.4 for Desktop. I am unsure though whether I am getting correct data from using the tool.
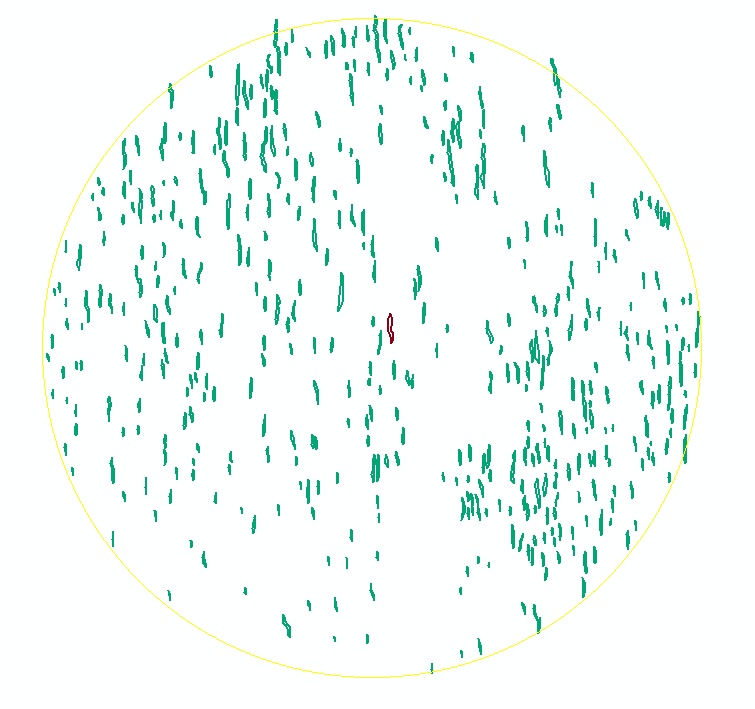
I opted to use rectangle by width, when I run it I only get intermittent data in the MGB Width field, either it has some data or is a zero. There are approximately 440 polygons in the first table. Attached are images of the polygons and a sample of the table output.
Any help would be greatly appreciated as I am now at my wits end. I just need to accurately get the length and width of the polygons. I will have to do it for varying numbers of polygons another 17 times.
Thanks
- Mark as New
- Bookmark
- Subscribe
- Mute
- Subscribe to RSS Feed
- Permalink
Hi Ken Walsh , not sure where to start, since there is a lot going on here.
I notice that you have a metric coordinate system and the width and height of the area is very small 35 - 40 cm. This affects the data. What does the data represent?
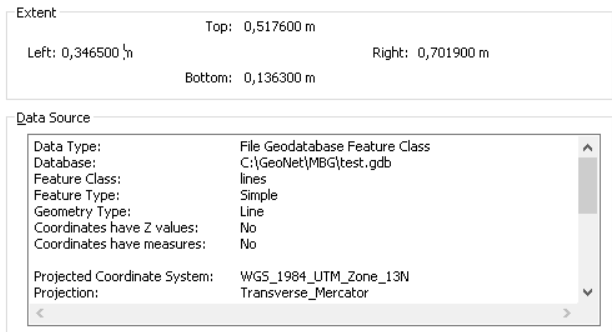
I notice that you send me a polyline shapefile and not polygons. When you want to obtain polygons digitizing them from a background (the image) you should directly capture them as polygons to avoid problems. Better yet, as the background image seems to have a continuous range of values, you could probably use a threshold value to create a raster containing only the areas you are interested in and convert those those raster areas to polygons (no need to digitize the polygons).
What I did with your data was to "move" them to a different location and give them a bigger size by defining the WGS1984 geographic coordinate system and projecting them to Web Mercator Auxiliary Sphere (which obviously will not be correct without knowing what the data represents). When I used the Feature to Polygon tool, it just created polygons for a small part of your data (see the green polygons in the image below). You can use the MBG (area by rectangle) on the lines as well to create rectangles around the lines (see purple-ish color rectangles).
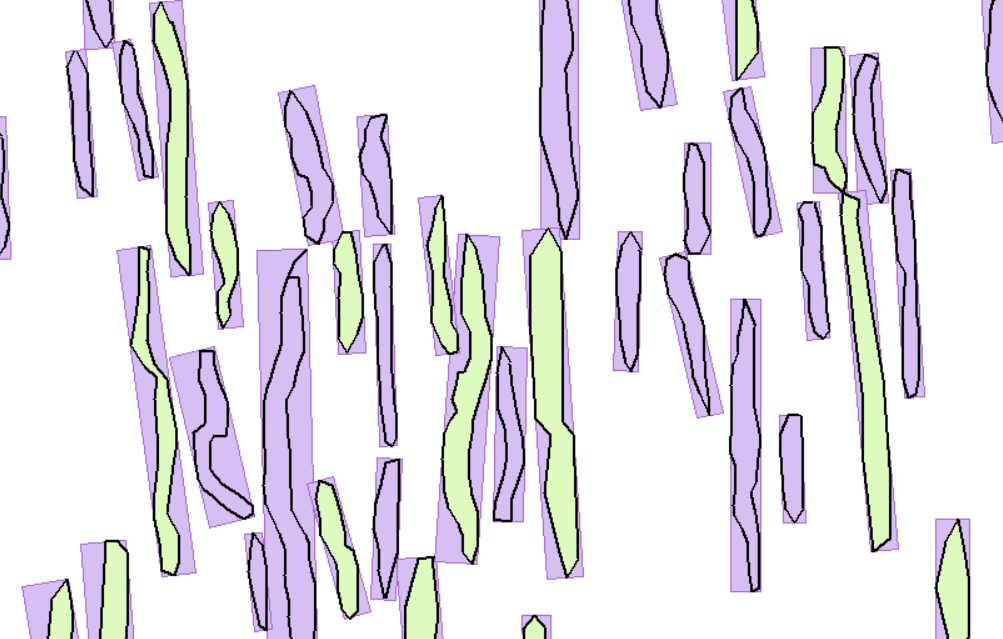
In case the polygons don't have too many curves, you could approximately determine the width of the polygons, by using the length from the rectangles and divide the area of the polygons by the length. This will approximately represent the average with of the polygons, but bear in mind that when a polygon has more curves the length is too small and the with will be bigger than it should be.
- Mark as New
- Bookmark
- Subscribe
- Mute
- Subscribe to RSS Feed
- Permalink
Thanks Xander, I will admit that I don't have very much GIS experience so some of what you detailed I may have to ask you about. The background is a layer of clay-cake, not very large as you pointed out. This is a geology experiment. When you apply tension to the cake from the left and right, small cracks will start to form, these represent rocks faulting. As more pressure is applied these small cracks grow into each other creating larger longer faults. So I have a selection of time series tiffs representing different strain amounts. I created a shape-file with a circle, an area of interest, see attached. I don't want near the perimeters as they will start to bow as the stretching increases. What I want to get from each of the cracks is the mid-line length and maximum width, if possible.
Now knowing GIS, I managed to get the tiffs in with a worldfile that I think makes sense. Overlay the tiff with AOI circle and then create a new shape-file and start by hand plotting each of the cracks. I had to choose a coordinate system so I chose WGS1984_UTM_Zone_13, I have no idea if thats what I should have chosen as this is a tiny rectangle not representing anywhere. To map each slide, as you can imagine, takes hours and there are a lot of slides, so if there is a more efficient way to accomplish this I would love to learn it. I admit from "threshold .... Feature to Polygon" in your post I was lost; ignorance is a curse. There are no curved lines on the polygons. Hope this makes it a little clearer.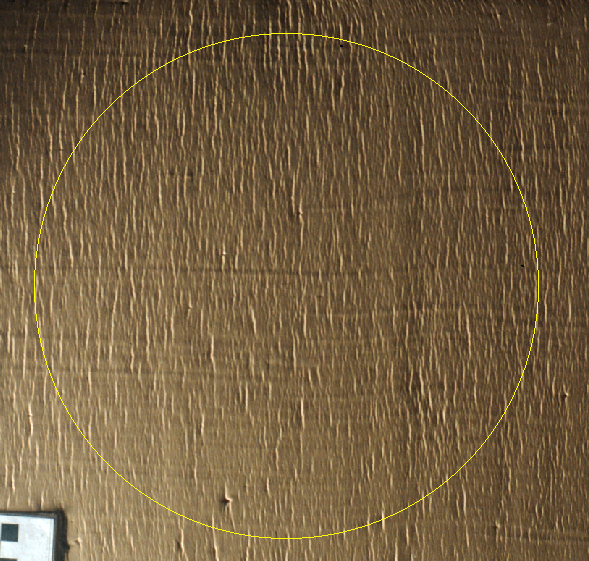
- Mark as New
- Bookmark
- Subscribe
- Mute
- Subscribe to RSS Feed
- Permalink
The "minimum area bounding rectangle (MABR)", as Xander has demonstrated, is the route to go.
Sadly, continuing to digitize in the interim would be the route to go, unless you want to venture into some form of image classification.
It appears that you will also have some issues with this given the lighting on the image not providing a unique signature across the image.
As a shortcut, you might want to just consider digitizing a rectangle of the approximate width and length, rotated appropriately over the image cracks. The finely digitized boundaries are going to get reduced to a rectangle anyway.... and I suspect "human-ware" might do a better job representing the aligned rectangle.
If you find a persistent mid-axis width being substantially larger, then a 'selection' of those features could be examined with the "minimum area bounding ellipse (MABE)" The MABE should fit nicely in the MABR if sufficient perimeter points are obtained. The MABE can be sliced to get widths across the long axis if needed... but you aren't going to do hundreds at once in any event, so stick with the MABR for the majority of work and look at the MABE for longer cracks.
Great application of GIS technology BTW. 
- Mark as New
- Bookmark
- Subscribe
- Mute
- Subscribe to RSS Feed
- Permalink
Thank you Mr. Patterson
- Mark as New
- Bookmark
- Subscribe
- Mute
- Subscribe to RSS Feed
- Permalink
If you have a time sequence of the imagery I have a few ideas.
It would only be useful if there registration locations on the clay-cake layer. I have done some work on image sequencing, image classification and pattern extraction from 'surfaces'.
Lighting needs to be consistent and the camera location fixed (checked with the registration 'points' … 4 corner dots from a Sharpie pen will do.)
Do you have the Image Analyst and/or the Spatial Analyst extensions? and do you have access to ArcGIS Pro?
- Mark as New
- Bookmark
- Subscribe
- Mute
- Subscribe to RSS Feed
- Permalink
Good morning gentlemen, Mr Patterson I'll have to check and see if I have those licenses. I do have a question for you both. If you were given 16 tiff files, that are not DEMs, contain no real metadata. You were tasked to map those cracks as they appear on each of the tiffs. Your goal is to map the faults and then get the length and width of the faults in order to build a computational model to replicate the faulting process. What would be the optimal way of achieving that the initial goals of mapping and calculating in ArcGIS 10.4?
- Mark as New
- Bookmark
- Subscribe
- Mute
- Subscribe to RSS Feed
- Permalink
First of all it depends of various aspects like which licenses and software you have access to. I would probably leave a manual interpretation as last resource. Lighting as Dan mentioned is very important. In case you want to do a automated process of interpreting the faults from the series of images, each image should have the same lighting and lighting should be the same for each part of the image (which does not seem the case in the example). Probably it would be possible to work with a threshold and using Spatial Analyst you could create a raster that contains the areas that you are interested in and convert those to polygons to start analyzing each polygon using the MBG.
Much depends on the quality of the data and the software you have access to.
- Mark as New
- Bookmark
- Subscribe
- Mute
- Subscribe to RSS Feed
- Permalink
Hi guys, I am back to this issue. I have finishing mapping all of the faults, over 20k of them. It is finished for now but may need to be done again. So I have returned to the issue of trying to "teach" ArcGIS to recognize the linear polygon shape from differences in shade (grayscale) and plotting the identified polygon. I am going to convert some of my tiffs to grayscale to see if I can achieve it. From the Minimum Bounding Geometry aspect, the numbers I got were sufficient although it would be nice to get more accurate numbers.
My questions:
If I am using ArcGIS Desktop 10.4 do you believe this may be achievable? If so, a possible path to achieve this?
If I were to upgrade to ArcGIS Pro, is it more achievable? Does ArcGIS Pro have better tools to accomplish what I am attempting?
Thank you again for all of your help with my problem.
Ken
- Mark as New
- Bookmark
- Subscribe
- Mute
- Subscribe to RSS Feed
- Permalink
You could try Machine Learning or Deep Learning to tackle this problem. A small video can be found here: Object Detection with TensorFlow and the ArcGIS API for Python - YouTube
Some more info here:
- « Previous
-
- 1
- 2
- Next »
- « Previous
-
- 1
- 2
- Next »